
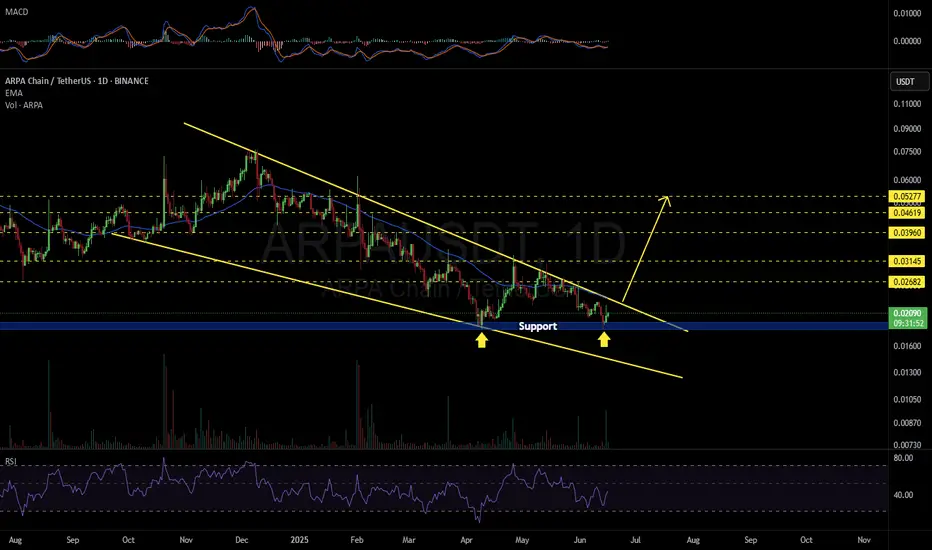
#ARPA is moving inside a Falling Wedge pattern on the daily chart — a classic bullish reversal signal.
If the price breaks above the wedge resistance and the daily EMA50, the following targets come into play:
🎯 $0.02682
🎯 $0.03145
🎯 $0.03960
🎯 $0.04619
🎯 $0.05277
⚠️ Always use a tight stop-loss to manage risk and protect your capital.
If the price breaks above the wedge resistance and the daily EMA50, the following targets come into play:
🎯 $0.02682
🎯 $0.03145
🎯 $0.03960
🎯 $0.04619
🎯 $0.05277
⚠️ Always use a tight stop-loss to manage risk and protect your capital.

Haftungsausschluss
Die Informationen und Veröffentlichungen sind nicht als Finanz-, Anlage-, Handels- oder andere Arten von Ratschlägen oder Empfehlungen gedacht, die von TradingView bereitgestellt oder gebilligt werden, und stellen diese nicht dar. Lesen Sie mehr in den Nutzungsbedingungen.
Haftungsausschluss
Die Informationen und Veröffentlichungen sind nicht als Finanz-, Anlage-, Handels- oder andere Arten von Ratschlägen oder Empfehlungen gedacht, die von TradingView bereitgestellt oder gebilligt werden, und stellen diese nicht dar. Lesen Sie mehr in den Nutzungsbedingungen.