
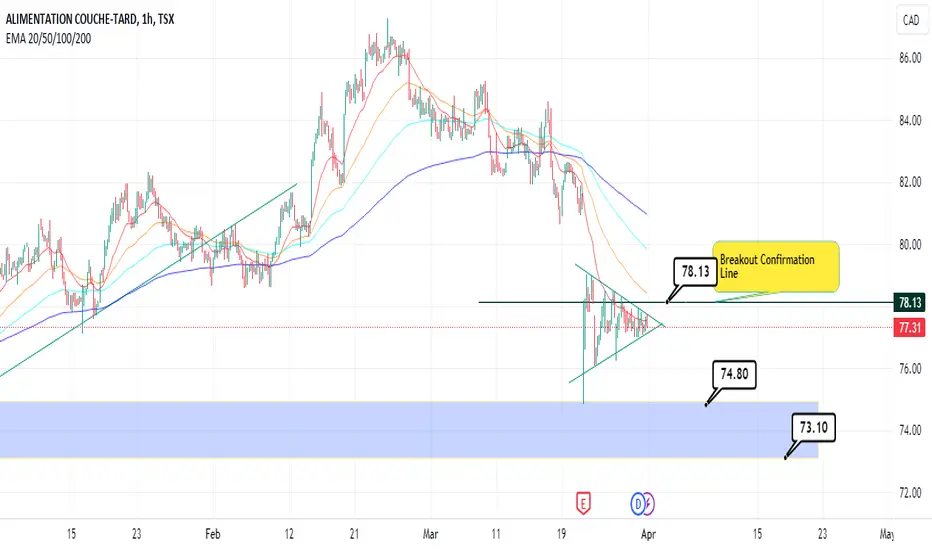
There’s a clear symmetric triangle nearing a breakout and it can go any side as this pattern typically indicates a period of consolidation, with the price breakout direction being uncertain.
In case of a bearish breakout, there’s a strong support zone between $74 and $73. I’d suggest you to wait until the price breaks out above the red EMA 20 line on this hourly chart.
In case of a bearish breakout, there’s a strong support zone between $74 and $73. I’d suggest you to wait until the price breaks out above the red EMA 20 line on this hourly chart.

Haftungsausschluss
Die Informationen und Veröffentlichungen sind nicht als Finanz-, Anlage-, Handels- oder andere Arten von Ratschlägen oder Empfehlungen gedacht, die von TradingView bereitgestellt oder gebilligt werden, und stellen diese nicht dar. Lesen Sie mehr in den Nutzungsbedingungen.
Haftungsausschluss
Die Informationen und Veröffentlichungen sind nicht als Finanz-, Anlage-, Handels- oder andere Arten von Ratschlägen oder Empfehlungen gedacht, die von TradingView bereitgestellt oder gebilligt werden, und stellen diese nicht dar. Lesen Sie mehr in den Nutzungsbedingungen.