

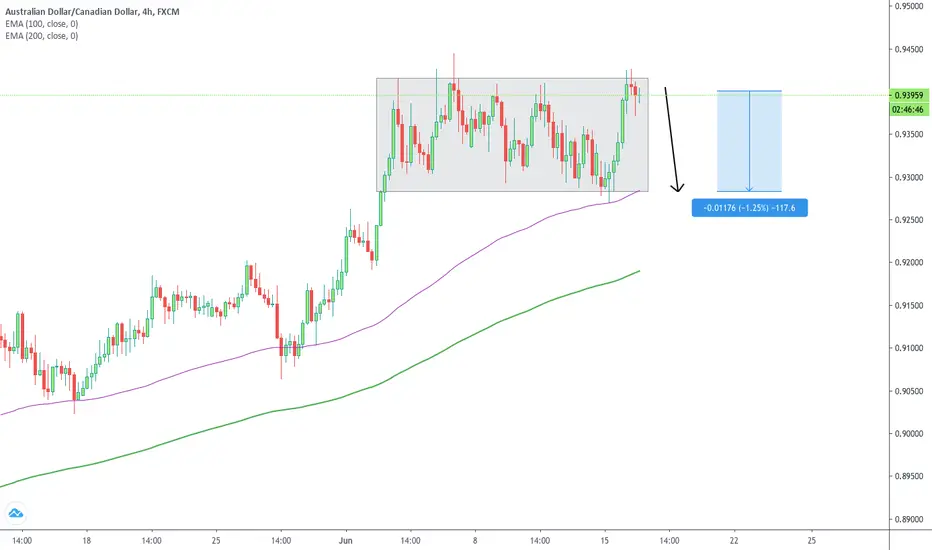
H4 analysis on AUDCAD shows price ranging between the 0.94000 - 0.93000 psychological levels since the beginning of the month.
Price action at the resistance area (long wicks, spinning tops/dojis) indicates price is struggling to break higher.
100+ pip drop potential, targeting the bottom of the range, in line with the 100 EMA where price may reject.
Price action at the resistance area (long wicks, spinning tops/dojis) indicates price is struggling to break higher.
100+ pip drop potential, targeting the bottom of the range, in line with the 100 EMA where price may reject.

Haftungsausschluss
Die Informationen und Veröffentlichungen sind nicht als Finanz-, Anlage-, Handels- oder andere Arten von Ratschlägen oder Empfehlungen gedacht, die von TradingView bereitgestellt oder gebilligt werden, und stellen diese nicht dar. Lesen Sie mehr in den Nutzungsbedingungen.
Haftungsausschluss
Die Informationen und Veröffentlichungen sind nicht als Finanz-, Anlage-, Handels- oder andere Arten von Ratschlägen oder Empfehlungen gedacht, die von TradingView bereitgestellt oder gebilligt werden, und stellen diese nicht dar. Lesen Sie mehr in den Nutzungsbedingungen.