

Let's start with the Daily View:

a) We can see 3 relevant horizontal levels. Those are the main areas we will be paying attention to. Now the price is above a resistance zone (working as support), and we will aim for a bullish movement towards the next resistance zone.
b) Another important item is a Huge Corrective Structure that has been broken (Bullish Signal)
Now we will go to the 1H chart:
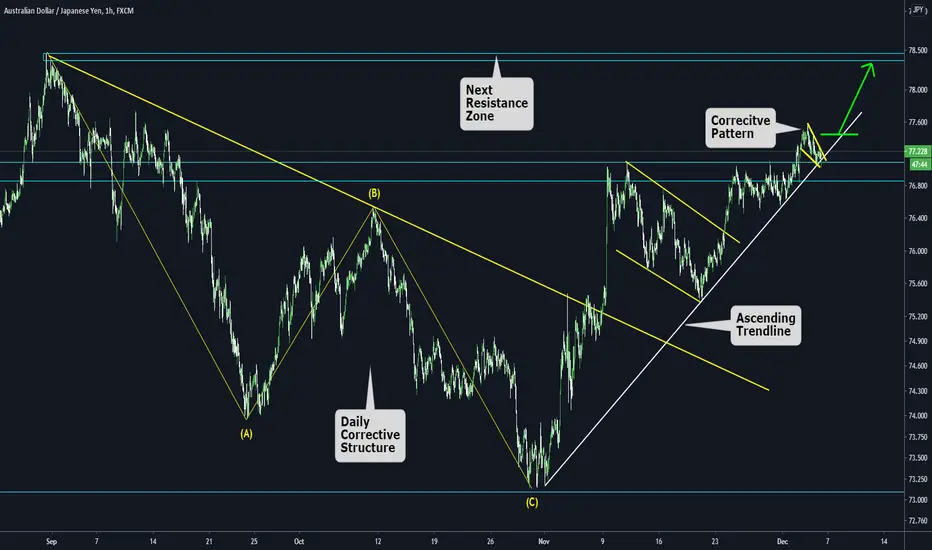
a) We can see the clear breakout of the Daily corrective Structure ABC pattern.
b) The price now is above the resistance zone, supporting a small corrective pattern + the Ascending trendline supporting the corrective pattern.
c) Based on those items, we expect a continuation of the bullish movement towards the next resistance zone.
a) We can see 3 relevant horizontal levels. Those are the main areas we will be paying attention to. Now the price is above a resistance zone (working as support), and we will aim for a bullish movement towards the next resistance zone.
b) Another important item is a Huge Corrective Structure that has been broken (Bullish Signal)
Now we will go to the 1H chart:
a) We can see the clear breakout of the Daily corrective Structure ABC pattern.
b) The price now is above the resistance zone, supporting a small corrective pattern + the Ascending trendline supporting the corrective pattern.
c) Based on those items, we expect a continuation of the bullish movement towards the next resistance zone.

Haftungsausschluss
Die Informationen und Veröffentlichungen sind nicht als Finanz-, Anlage-, Handels- oder andere Arten von Ratschlägen oder Empfehlungen gedacht, die von TradingView bereitgestellt oder gebilligt werden, und stellen diese nicht dar. Lesen Sie mehr in den Nutzungsbedingungen.
Haftungsausschluss
Die Informationen und Veröffentlichungen sind nicht als Finanz-, Anlage-, Handels- oder andere Arten von Ratschlägen oder Empfehlungen gedacht, die von TradingView bereitgestellt oder gebilligt werden, und stellen diese nicht dar. Lesen Sie mehr in den Nutzungsbedingungen.