

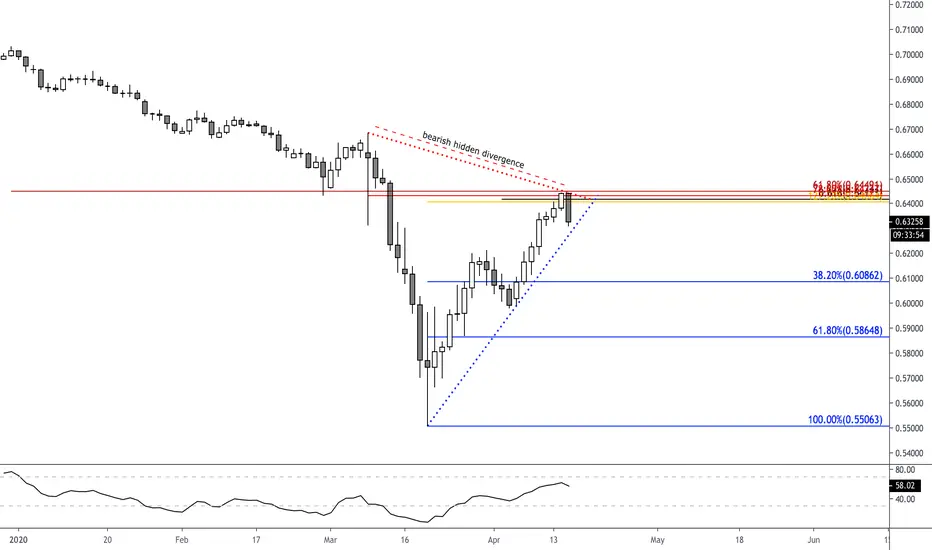
A fibonacci cluster indicates potential reversal zones, on any chart, in any market. They are used to anticipate major support/resistance levels.
In this chart the cluster is made up by 4 different levels, consisting of:
61.8% retracement (dark red)
78.6% retracement (red)
127.2% extension (golden)
0.618 projection (black)
Bearish hidden divergence, in which price forms a lower high while the oscillator is showing higher highs, confirms the short bias.
The blue levels show potential support levels.
Looks like $ is gaining strength ??
Good luck to all trading AUDUSD
In this chart the cluster is made up by 4 different levels, consisting of:
61.8% retracement (dark red)
78.6% retracement (red)
127.2% extension (golden)
0.618 projection (black)
Bearish hidden divergence, in which price forms a lower high while the oscillator is showing higher highs, confirms the short bias.
The blue levels show potential support levels.
Looks like $ is gaining strength ??
Good luck to all trading AUDUSD
Anmerkung
Here is how the 4H timeframe looks like:Anmerkung
This chart is very similar to NZDUSD
Haftungsausschluss
Die Informationen und Veröffentlichungen sind nicht als Finanz-, Anlage-, Handels- oder andere Arten von Ratschlägen oder Empfehlungen gedacht, die von TradingView bereitgestellt oder gebilligt werden, und stellen diese nicht dar. Lesen Sie mehr in den Nutzungsbedingungen.
Haftungsausschluss
Die Informationen und Veröffentlichungen sind nicht als Finanz-, Anlage-, Handels- oder andere Arten von Ratschlägen oder Empfehlungen gedacht, die von TradingView bereitgestellt oder gebilligt werden, und stellen diese nicht dar. Lesen Sie mehr in den Nutzungsbedingungen.