

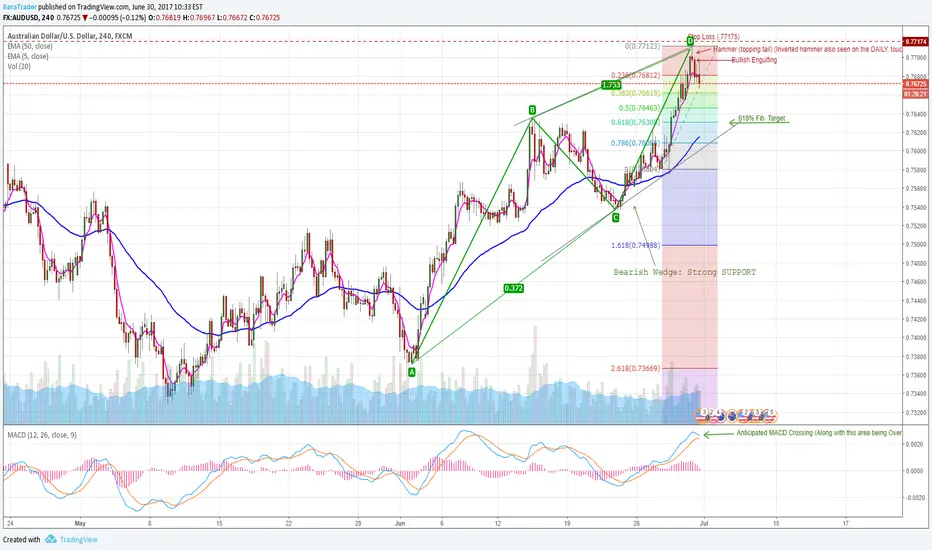
H4 Chart Technical Analysis: Short
Candlestick analysis of a bullish real body followed by an inverted hammer/topping tail, to a bearish engulfing (of the bullish).
Alongside this we have the MACD's anticipated crossing over and Overbought RSI at the time of the inverted hammer.
My target is not necessarily to 'touch' the bullish trend line of support, but to retrace to the .618% fib. as a correction.
All of this contained within a bearish ABCD pattern.
Thanks Guys,
Kera
Candlestick analysis of a bullish real body followed by an inverted hammer/topping tail, to a bearish engulfing (of the bullish).
Alongside this we have the MACD's anticipated crossing over and Overbought RSI at the time of the inverted hammer.
My target is not necessarily to 'touch' the bullish trend line of support, but to retrace to the .618% fib. as a correction.
All of this contained within a bearish ABCD pattern.
Thanks Guys,
Kera

Haftungsausschluss
Die Informationen und Veröffentlichungen sind nicht als Finanz-, Anlage-, Handels- oder andere Arten von Ratschlägen oder Empfehlungen gedacht, die von TradingView bereitgestellt oder gebilligt werden, und stellen diese nicht dar. Lesen Sie mehr in den Nutzungsbedingungen.
Haftungsausschluss
Die Informationen und Veröffentlichungen sind nicht als Finanz-, Anlage-, Handels- oder andere Arten von Ratschlägen oder Empfehlungen gedacht, die von TradingView bereitgestellt oder gebilligt werden, und stellen diese nicht dar. Lesen Sie mehr in den Nutzungsbedingungen.