

HELLO TRADERS
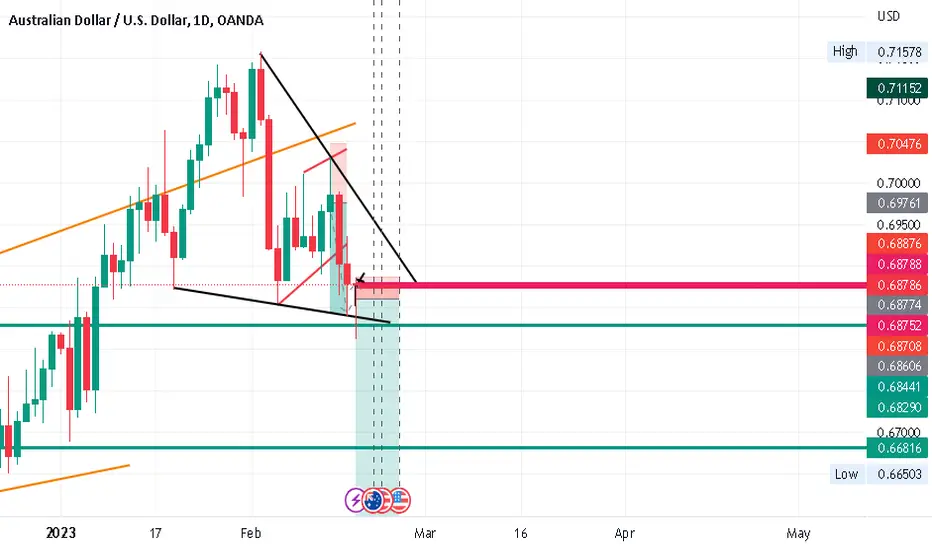
It seems like on a weekly timeframe this pair reached a resistance or supply zone(LOWER HIGH) and to back this up with top down analysis on a daily timeframe, the market formed a head and shoulders chart pattern which is a reversal chart pattern.
Moving on to the 4 Hour timeframe the market broke the neckline, probably confirming the new direction of the market.
Before any sell orders the market has to go through a correction phase to release buyers that are still in the market.
On the 1 Hour timeframe, traders should be vigilant for reversal candlestick pattern, chart pattern or Fibonacci retracement for entries......
N.B THIS ANALYSIS CAN ALSO BE USED ON CORRELATING PAIRS:
EURUSD
GBPUSD
NZDUSD
USDCHF
USDJPY
It seems like on a weekly timeframe this pair reached a resistance or supply zone(LOWER HIGH) and to back this up with top down analysis on a daily timeframe, the market formed a head and shoulders chart pattern which is a reversal chart pattern.
Moving on to the 4 Hour timeframe the market broke the neckline, probably confirming the new direction of the market.
Before any sell orders the market has to go through a correction phase to release buyers that are still in the market.
On the 1 Hour timeframe, traders should be vigilant for reversal candlestick pattern, chart pattern or Fibonacci retracement for entries......
N.B THIS ANALYSIS CAN ALSO BE USED ON CORRELATING PAIRS:
EURUSD
GBPUSD
NZDUSD
USDCHF
USDJPY

Haftungsausschluss
Die Informationen und Veröffentlichungen sind nicht als Finanz-, Anlage-, Handels- oder andere Arten von Ratschlägen oder Empfehlungen gedacht, die von TradingView bereitgestellt oder gebilligt werden, und stellen diese nicht dar. Lesen Sie mehr in den Nutzungsbedingungen.
Haftungsausschluss
Die Informationen und Veröffentlichungen sind nicht als Finanz-, Anlage-, Handels- oder andere Arten von Ratschlägen oder Empfehlungen gedacht, die von TradingView bereitgestellt oder gebilligt werden, und stellen diese nicht dar. Lesen Sie mehr in den Nutzungsbedingungen.