
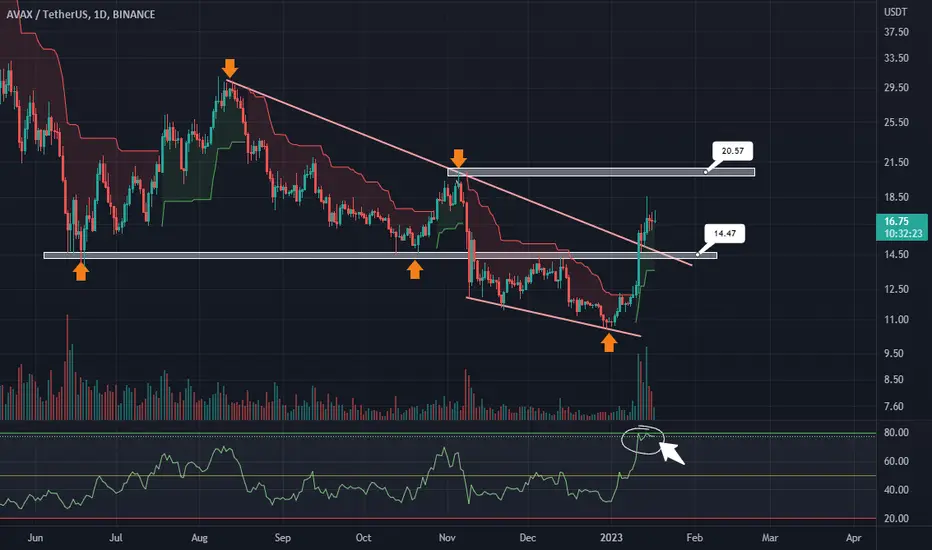
Here we can the daily chart of "AVAXUSDT" it has a horizontal SUPPORT at "14.47" and a horizontal RESISTANCE at "20.57". As we can see the candle already has taken breakout from the trendline with a high volume and if the candle retests the support zone then we can definetly look for a long opportunity from that zone and can expect a terget of "20.57" till then keep an eye on the support zone. And you can also see that the chart is making a double bottom and the pattern gets complete ot the resistance "20.57". Make trade ENTRY at the "14.47" zone with a TIGHT STOPLOSS at "13.90" and the TARGET ZONE at "20.57".
ENJOY !!!
ENJOY !!!

Haftungsausschluss
Die Informationen und Veröffentlichungen sind nicht als Finanz-, Anlage-, Handels- oder andere Arten von Ratschlägen oder Empfehlungen gedacht, die von TradingView bereitgestellt oder gebilligt werden, und stellen diese nicht dar. Lesen Sie mehr in den Nutzungsbedingungen.
Haftungsausschluss
Die Informationen und Veröffentlichungen sind nicht als Finanz-, Anlage-, Handels- oder andere Arten von Ratschlägen oder Empfehlungen gedacht, die von TradingView bereitgestellt oder gebilligt werden, und stellen diese nicht dar. Lesen Sie mehr in den Nutzungsbedingungen.