
Avalanche (AVAX) technical analysis:
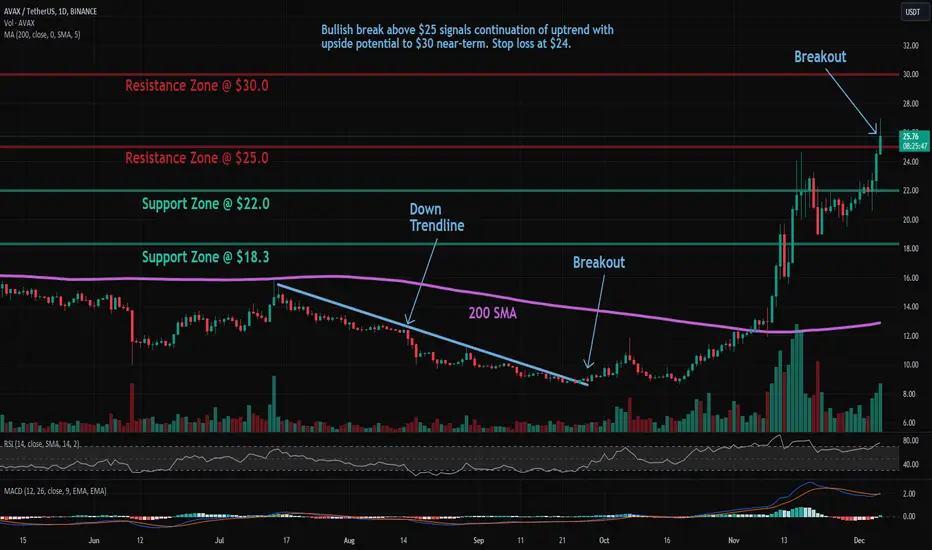
Trade setup: Bullish break above $25 signals continuation of uptrend with upside potential to $30 near-term. Stop loss at $24. Previously, price broke above 200-day moving average, which confirmed a bullish trend reversal to an Uptrend.
Trend: Uptrend across all time horizons (Short- Medium- and Long-Term).
Momentum is Bullish (MACD Line is above MACD Signal Line and RSI is above 55).
Support and Resistance: Nearest Support Zone is $22.0 (previous resistance), then $18.3. The nearest Resistance Zone is $25.0, which it broke, then $30.0.
Trade setup: Bullish break above $25 signals continuation of uptrend with upside potential to $30 near-term. Stop loss at $24. Previously, price broke above 200-day moving average, which confirmed a bullish trend reversal to an Uptrend.
Trend: Uptrend across all time horizons (Short- Medium- and Long-Term).
Momentum is Bullish (MACD Line is above MACD Signal Line and RSI is above 55).
Support and Resistance: Nearest Support Zone is $22.0 (previous resistance), then $18.3. The nearest Resistance Zone is $25.0, which it broke, then $30.0.

Haftungsausschluss
Die Informationen und Veröffentlichungen sind nicht als Finanz-, Anlage-, Handels- oder andere Arten von Ratschlägen oder Empfehlungen gedacht, die von TradingView bereitgestellt oder gebilligt werden, und stellen diese nicht dar. Lesen Sie mehr in den Nutzungsbedingungen.
Haftungsausschluss
Die Informationen und Veröffentlichungen sind nicht als Finanz-, Anlage-, Handels- oder andere Arten von Ratschlägen oder Empfehlungen gedacht, die von TradingView bereitgestellt oder gebilligt werden, und stellen diese nicht dar. Lesen Sie mehr in den Nutzungsbedingungen.