
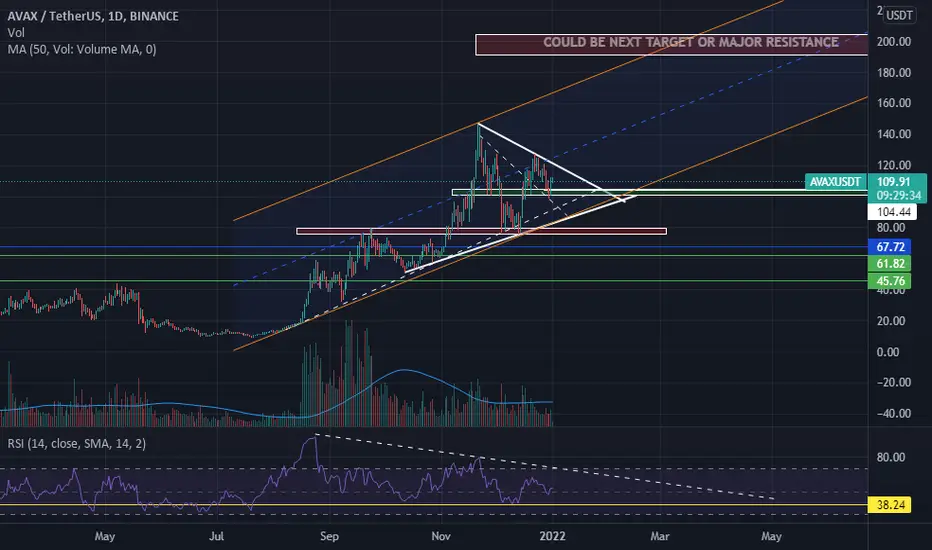
I am sharing AAVAX/USDT's support, Resistance, and possible long-term targets.
As you can see price is maintaining its upside movement in an upside Parallel channel on a daily timeframe.
Plus there is a symmetrical triangle on the price chart which is bullish and if I measure the size and see the possible target is the same as Fib 1.618.
Also if you see RSI bouncing again and again from the yellow line I have marked on it. As it is working as support.
NOTE: #DYOR
As you can see price is maintaining its upside movement in an upside Parallel channel on a daily timeframe.
Plus there is a symmetrical triangle on the price chart which is bullish and if I measure the size and see the possible target is the same as Fib 1.618.
Also if you see RSI bouncing again and again from the yellow line I have marked on it. As it is working as support.
NOTE: #DYOR

Haftungsausschluss
Die Informationen und Veröffentlichungen sind nicht als Finanz-, Anlage-, Handels- oder andere Arten von Ratschlägen oder Empfehlungen gedacht, die von TradingView bereitgestellt oder gebilligt werden, und stellen diese nicht dar. Lesen Sie mehr in den Nutzungsbedingungen.
Haftungsausschluss
Die Informationen und Veröffentlichungen sind nicht als Finanz-, Anlage-, Handels- oder andere Arten von Ratschlägen oder Empfehlungen gedacht, die von TradingView bereitgestellt oder gebilligt werden, und stellen diese nicht dar. Lesen Sie mehr in den Nutzungsbedingungen.