
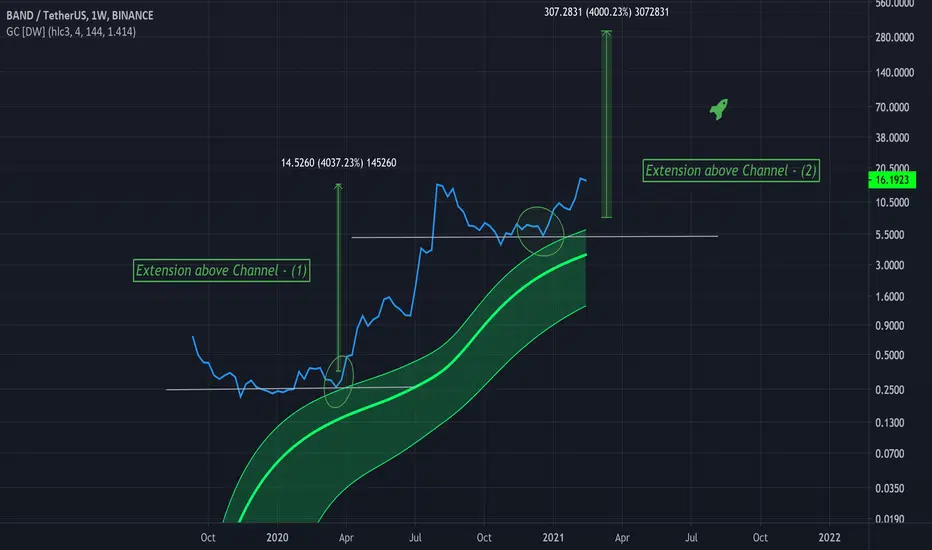
Within the green circles touches on the Gaussian channel can be seen, well, clearly on the first one, the second one is a bit above.
This is a great bounce area for price as price is in a full bull trend, as shown by the Gaussian indicator.
This is the chart for BANDUSDT, and if this second circle acts as a touch on the Gaussian indicator a strong bounce upward could occur.
And if history holds any merit, a 4000% move up could be in play.
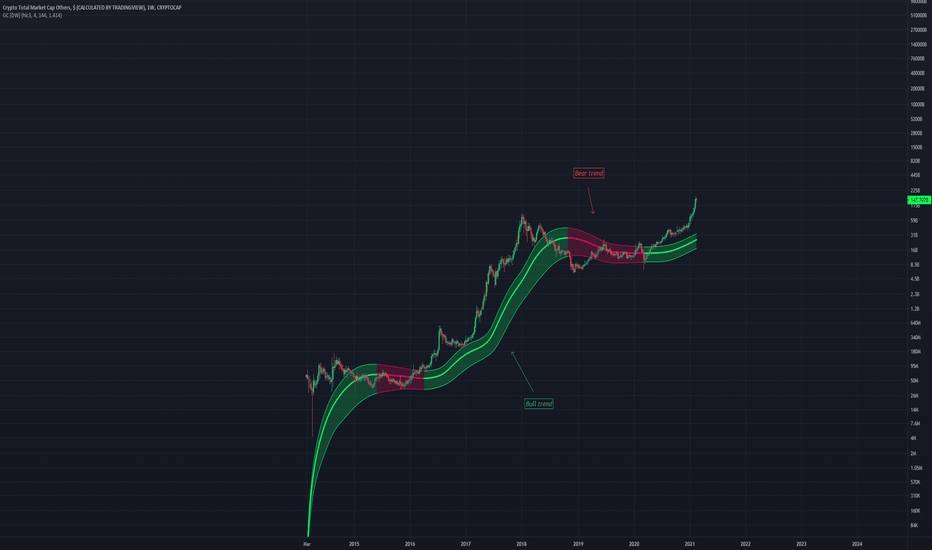
Above is a chart that has a link to this indicator in the comments.
It is very helpful.
This is a great bounce area for price as price is in a full bull trend, as shown by the Gaussian indicator.
This is the chart for BANDUSDT, and if this second circle acts as a touch on the Gaussian indicator a strong bounce upward could occur.
And if history holds any merit, a 4000% move up could be in play.
Above is a chart that has a link to this indicator in the comments.
It is very helpful.

Haftungsausschluss
Die Informationen und Veröffentlichungen sind nicht als Finanz-, Anlage-, Handels- oder andere Arten von Ratschlägen oder Empfehlungen gedacht, die von TradingView bereitgestellt oder gebilligt werden, und stellen diese nicht dar. Lesen Sie mehr in den Nutzungsbedingungen.
Haftungsausschluss
Die Informationen und Veröffentlichungen sind nicht als Finanz-, Anlage-, Handels- oder andere Arten von Ratschlägen oder Empfehlungen gedacht, die von TradingView bereitgestellt oder gebilligt werden, und stellen diese nicht dar. Lesen Sie mehr in den Nutzungsbedingungen.