Dear Traders,
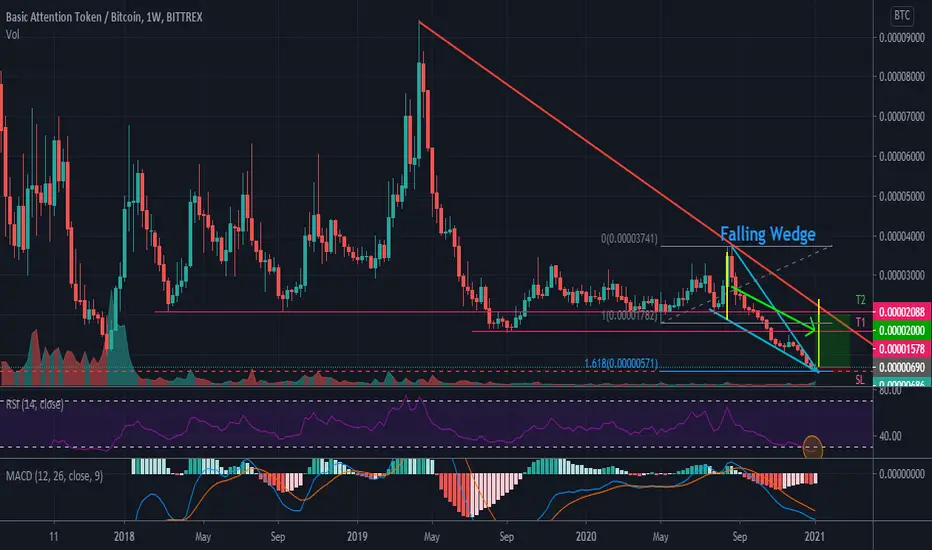
As you can see in the RSI BAT is oversold in the weekly time frame.
Looking at the chart we can identify that price structure has also formed a falling wedge.
If we look at fibbonaccis we can see that BAT could have found support @ 1.618 fib level.
If we look at BAT in the |DAILY TIMEFRAME|, MACD already signals a bullish cross.
I expect alts to try something while bitcoin rests for a while.
Targets:
Stop-Loss:
I know that SL is a bit extreme but at this levels it's better not to sell until we break previous minimum prices.
I wish you the best of luck!
As you can see in the RSI BAT is oversold in the weekly time frame.
Looking at the chart we can identify that price structure has also formed a falling wedge.
If we look at fibbonaccis we can see that BAT could have found support @ 1.618 fib level.
If we look at BAT in the |DAILY TIMEFRAME|, MACD already signals a bullish cross.
I expect alts to try something while bitcoin rests for a while.
Targets:
- TP1: 0.00001569 Satoshis
- TP2: 0.00002000 Satoshis
Stop-Loss:
- SL: 0.00000575
I know that SL is a bit extreme but at this levels it's better not to sell until we break previous minimum prices.
I wish you the best of luck!
Trade ist aktiv
Here we go!Trade wurde manuell geschlossen
Accumulating some satoshis in BTC
Haftungsausschluss
Die Informationen und Veröffentlichungen sind nicht als Finanz-, Anlage-, Handels- oder andere Arten von Ratschlägen oder Empfehlungen gedacht, die von TradingView bereitgestellt oder gebilligt werden, und stellen diese nicht dar. Lesen Sie mehr in den Nutzungsbedingungen.
Haftungsausschluss
Die Informationen und Veröffentlichungen sind nicht als Finanz-, Anlage-, Handels- oder andere Arten von Ratschlägen oder Empfehlungen gedacht, die von TradingView bereitgestellt oder gebilligt werden, und stellen diese nicht dar. Lesen Sie mehr in den Nutzungsbedingungen.