
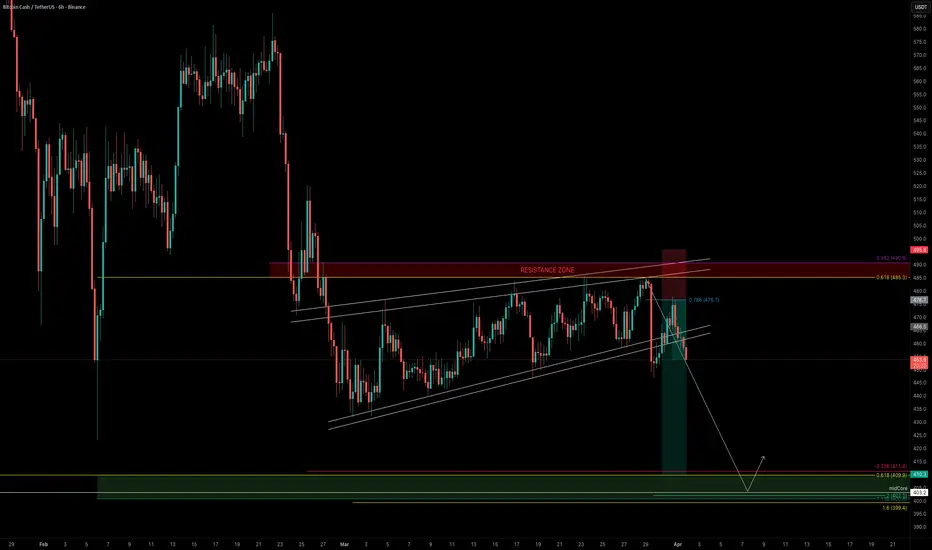
BCH has been consolidating for the past 33 days, forming a clear sideways range that now resembles a bearish flag structure below a key support-turned-resistance zone.
The loss of the $500 psychological level is significant not just structurally, but also from a sentiment perspective. What was once support is now acting as a ceiling.
Market Structure & Context
Zooming out, BCH is showing:
The $485–$490 zone stands out as a critical level. Price has consistently failed to break and hold above it, often getting rejected before even properly testing higher liquidity.
This kind of behavior typically signals absorption from sellers and lack of demand at higher prices.
Pattern Breakdown — Bearish Flag
The current structure resembles a textbook bearish flag:
This type of formation often resolves with a continuation to the downside, especially when aligned with broader bearish market conditions.
Trade Plan — Short Setup
The setup is clean and defined:
Why $400?
This creates a high-probability setup with clear structure.
Ideal Scenario
The most optimal path would be:
Potential Long Setup
If price reaches the $400 zone, I’d shift focus to:
That area could provide a counter-trend long opportunity, but only with confirmation.
Key Takeaway
This is a classic continuation setup:
_________________________________
💬 If you found this helpful, drop a like and comment!
The loss of the $500 psychological level is significant not just structurally, but also from a sentiment perspective. What was once support is now acting as a ceiling.
Market Structure & Context
Zooming out, BCH is showing:
- Weak recovery attempts
- Lower highs within the range
- Lack of bullish momentum
- Repeated rejections below resistance
The $485–$490 zone stands out as a critical level. Price has consistently failed to break and hold above it, often getting rejected before even properly testing higher liquidity.
This kind of behavior typically signals absorption from sellers and lack of demand at higher prices.
Pattern Breakdown — Bearish Flag
The current structure resembles a textbook bearish flag:
- Sharp impulsive move down
- Followed by a slow, choppy upward/sideways consolidation
- Volume contraction during the range
This type of formation often resolves with a continuation to the downside, especially when aligned with broader bearish market conditions.
Trade Plan — Short Setup
The setup is clean and defined:
- Entry: Within / below the $485–$490 resistance zone
- Invalidation: Sustained break and acceptance above $490
- Target: $400
Why $400?
- Strong psychological level
- Likely liquidity pool
- Measured move from the flag structure
- Potential higher timeframe demand zone
This creates a high-probability setup with clear structure.
Ideal Scenario
The most optimal path would be:
- Breakdown from the range
- Acceleration toward $400
Potential Long Setup
If price reaches the $400 zone, I’d shift focus to:
- Reaction strength
- Volume spike
- Reversal structure
That area could provide a counter-trend long opportunity, but only with confirmation.
Key Takeaway
This is a classic continuation setup:
- Impulse down → Bearish flag → Resistance holds → Breakdown
_________________________________
💬 If you found this helpful, drop a like and comment!
Anmerkung
4H Trend:Anmerkung
Short target remains around $400:
🏆 Mastering Fibonacci for precision trading
🔹 Sharing high-probability trade setups
⚡ Unlock the power of technical analysis!
🔹 Sharing high-probability trade setups
⚡ Unlock the power of technical analysis!
Verbundene Veröffentlichungen
Haftungsausschluss
Die Informationen und Veröffentlichungen sind nicht als Finanz-, Anlage-, Handels- oder andere Arten von Ratschlägen oder Empfehlungen gedacht, die von TradingView bereitgestellt oder gebilligt werden, und stellen diese nicht dar. Lesen Sie mehr in den Nutzungsbedingungen.