
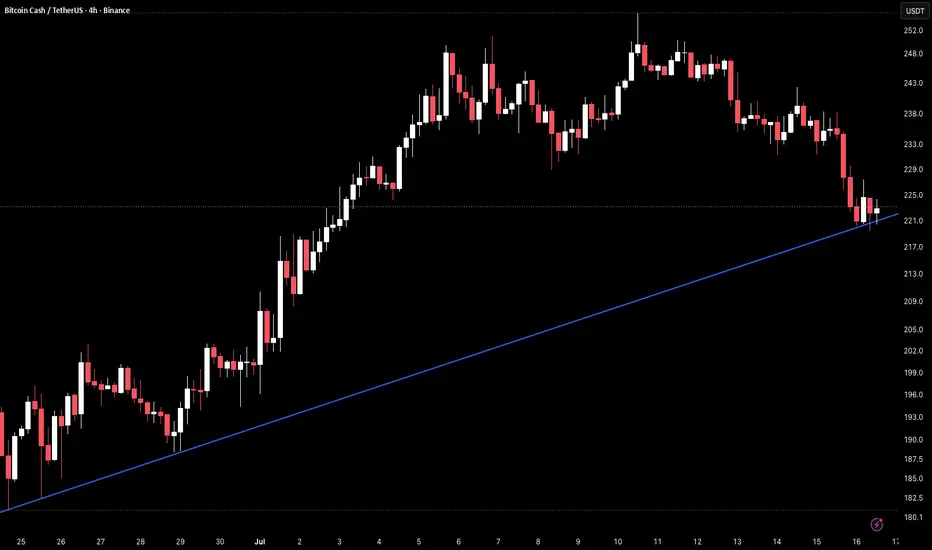
BCH on the 4H timeframe is currently trading around 223.3 after pushing from the rising trendline near 190 in late June all the way to a high near 252 on July 10 before sellers pushed price back through the 225.0 horizontal level, with the rising trendline now climbing into the 217–220 area and approaching as the next key test.
The chart shows a rising trendline originating from the late June low near 182–184, connecting the June 29 higher low near 190 and continuing to climb steeply through the entire visible structure. Price broke above the 225.0 horizontal level in early July on a sustained rally that reached 252 before rolling over. The selloff from that high has been steady, pulling price back through 238, 233, and now below 225.0 which had previously acted as a consistent pivot across the left side of the chart and is now being lost. The rising trendline is currently climbing into the 217–220 zone and is the only remaining upward structure beneath current price, with no meaningful horizontal support between the 225.0 broken level and the trendline below.
Price has lost the 225.0 horizontal level and is now approaching the rising trendline with momentum still pointing lower, making the trendline test the most important level to watch on this chart.
Key Levels To Watch
→ 250.0–252.0 – July high, major resistance above
→ 243.0–246.0 – Prior consolidation zone, resistance
→ 233.0–235.0 – Mid-range resistance zone
→ 225.0–227.0 – Broken horizontal support, now resistance
→ 221.0–223.0 – Current price, minor support
→ 217.0–220.0 – Rising trendline, dynamic support (climbing)
→ Below 210.0 – Trendline breakdown, extended downside
A hold at the rising trendline near 217–220 and a recovery back above 225.0–227.0 would confirm the trendline as active support and reopen the path toward 233–235 and potentially a retest of the July high near 250–252 on continuation.
A confirmed 4H close below the rising trendline near 217–220 would break the only upward structure on this chart, removing the trendline that has defined every significant low since late June and opening downside toward 210 and below with no clear support in between.
Pullback from July high now pressing into rising trendline, key test approaching. Hold 217–220 trendline and reclaim 225.0 → recovery resumes, eyes on 233–252. Lose trendline → structure broken, downside toward 210 and below. Bias bullish above rising trendline. Shift only on confirmed close below 217–220.
The chart shows a rising trendline originating from the late June low near 182–184, connecting the June 29 higher low near 190 and continuing to climb steeply through the entire visible structure. Price broke above the 225.0 horizontal level in early July on a sustained rally that reached 252 before rolling over. The selloff from that high has been steady, pulling price back through 238, 233, and now below 225.0 which had previously acted as a consistent pivot across the left side of the chart and is now being lost. The rising trendline is currently climbing into the 217–220 zone and is the only remaining upward structure beneath current price, with no meaningful horizontal support between the 225.0 broken level and the trendline below.
Price has lost the 225.0 horizontal level and is now approaching the rising trendline with momentum still pointing lower, making the trendline test the most important level to watch on this chart.
Key Levels To Watch
→ 250.0–252.0 – July high, major resistance above
→ 243.0–246.0 – Prior consolidation zone, resistance
→ 233.0–235.0 – Mid-range resistance zone
→ 225.0–227.0 – Broken horizontal support, now resistance
→ 221.0–223.0 – Current price, minor support
→ 217.0–220.0 – Rising trendline, dynamic support (climbing)
→ Below 210.0 – Trendline breakdown, extended downside
A hold at the rising trendline near 217–220 and a recovery back above 225.0–227.0 would confirm the trendline as active support and reopen the path toward 233–235 and potentially a retest of the July high near 250–252 on continuation.
A confirmed 4H close below the rising trendline near 217–220 would break the only upward structure on this chart, removing the trendline that has defined every significant low since late June and opening downside toward 210 and below with no clear support in between.
Pullback from July high now pressing into rising trendline, key test approaching. Hold 217–220 trendline and reclaim 225.0 → recovery resumes, eyes on 233–252. Lose trendline → structure broken, downside toward 210 and below. Bias bullish above rising trendline. Shift only on confirmed close below 217–220.

Haftungsausschluss
Die Informationen und Veröffentlichungen sind nicht als Finanz-, Anlage-, Handels- oder andere Arten von Ratschlägen oder Empfehlungen gedacht, die von TradingView bereitgestellt oder gebilligt werden, und stellen diese nicht dar. Lesen Sie mehr in den Nutzungsbedingungen.
Haftungsausschluss
Die Informationen und Veröffentlichungen sind nicht als Finanz-, Anlage-, Handels- oder andere Arten von Ratschlägen oder Empfehlungen gedacht, die von TradingView bereitgestellt oder gebilligt werden, und stellen diese nicht dar. Lesen Sie mehr in den Nutzungsbedingungen.