
💰 BEPC.TO — Swing Trade Breakdown
Brookfield Renewable (BEPC) just printed a clean RSI2 pullback right into the rising 50-SMA after a strong November run. This is one of the better mean-reversion structures on the TSX right now, especially in a rate-cooling environment where renewables finally have a tailwind again.
🏢 Company Snapshot
BEPC operates one of the largest global renewable energy platforms (hydro, solar, wind). The stock has been basing for months, finally broke out, and is now retesting support with an oversold short-term setup — the exact pattern my system is built for.
📊 Fundamentals (Quick Read)
Not a perfect earnings story but cash flow is strong enough to support the business model:
P/E: N/A due to depreciation-heavy structure
P/B: ~1.7× — reasonable for utilities
Debt/Equity: ~1.1 — high but normal for long-duration assets
ROE: Negative — expected with leveraged renewables
Dividend: ~4.3% — strong income component
FCF: Improving YoY
Cash: ~$700M+ liquidity
Summary: Steady cash flow business with high leverage but a stable long-term profile. Rate cuts would help significantly.
📈 Trends & Catalysts
Revenue: Mid-single-digit growth
EPS: Improving but still choppy
Cash Flow: Consistently rising
Balance Sheet: Leverage high but manageable
Catalysts: Falling yields, ongoing asset recycling, ESG flows
Risks: Rate shocks, refinancing cycles, project delays
🪙 Sector Snapshot
Utilities / Renewables are finally stabilizing after a long drawdown. Lower yields = stronger bids in defensive, cash-flow-heavy sectors. BEPC is showing early leadership this month.
📐 Technical Breakdown
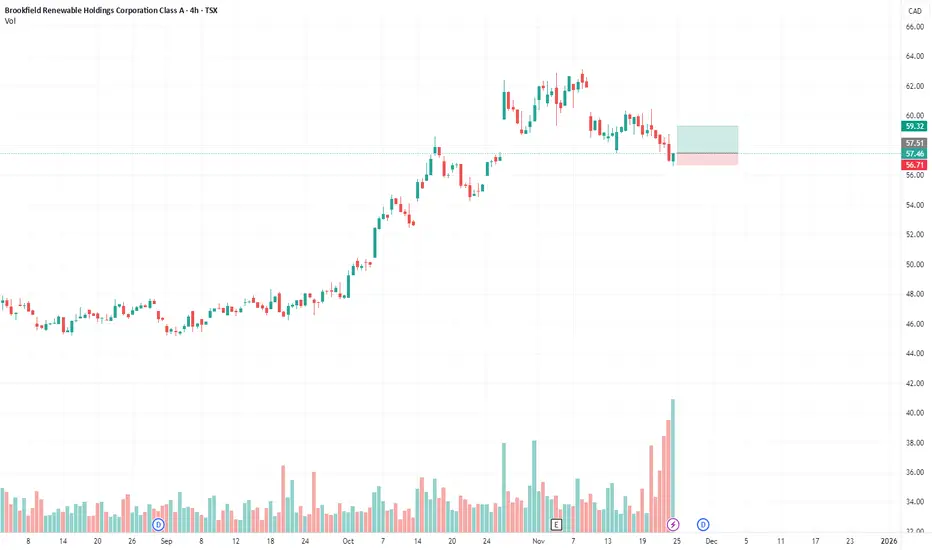
Price is sitting directly on the rising 50-SMA with RSI(2) in extreme oversold territory — a classic Connors-style trigger. Long-term trend intact with price well above the 200-SMA.
Key Levels
Price: $57.46
50-SMA: ~$56.70
200-SMA: ~$49.50
RSI(2): ~3–4 (oversold)
Support: $56.00–56.70
Resistance: $59.50–61.00
Volume: Accumulation spikes on green days
The chart shows a controlled pullback with no breakdown — just a retest of prior demand.
🎯 Trade Plan
Entry Zone: $57.00–57.60 (already hit)
Stop: $56.00 (below SMA + wick lows)
Target: $59.50–60.00
R/R: ~2:1 to 2.5:1
Alternate Setup: Add on a reclaim of $59 with volume for a continuation breakout
🧠 My Take
This is exactly the type of pullback I want — oversold RSI2, clean 50-SMA touch, rising trend, and the sector gaining momentum. As long as $56 holds, I like the bounce back into the $59–60 zone. Great structure for a short-duration swing.
Brookfield Renewable (BEPC) just printed a clean RSI2 pullback right into the rising 50-SMA after a strong November run. This is one of the better mean-reversion structures on the TSX right now, especially in a rate-cooling environment where renewables finally have a tailwind again.
🏢 Company Snapshot
BEPC operates one of the largest global renewable energy platforms (hydro, solar, wind). The stock has been basing for months, finally broke out, and is now retesting support with an oversold short-term setup — the exact pattern my system is built for.
📊 Fundamentals (Quick Read)
Not a perfect earnings story but cash flow is strong enough to support the business model:
P/E: N/A due to depreciation-heavy structure
P/B: ~1.7× — reasonable for utilities
Debt/Equity: ~1.1 — high but normal for long-duration assets
ROE: Negative — expected with leveraged renewables
Dividend: ~4.3% — strong income component
FCF: Improving YoY
Cash: ~$700M+ liquidity
Summary: Steady cash flow business with high leverage but a stable long-term profile. Rate cuts would help significantly.
📈 Trends & Catalysts
Revenue: Mid-single-digit growth
EPS: Improving but still choppy
Cash Flow: Consistently rising
Balance Sheet: Leverage high but manageable
Catalysts: Falling yields, ongoing asset recycling, ESG flows
Risks: Rate shocks, refinancing cycles, project delays
🪙 Sector Snapshot
Utilities / Renewables are finally stabilizing after a long drawdown. Lower yields = stronger bids in defensive, cash-flow-heavy sectors. BEPC is showing early leadership this month.
📐 Technical Breakdown
Price is sitting directly on the rising 50-SMA with RSI(2) in extreme oversold territory — a classic Connors-style trigger. Long-term trend intact with price well above the 200-SMA.
Key Levels
Price: $57.46
50-SMA: ~$56.70
200-SMA: ~$49.50
RSI(2): ~3–4 (oversold)
Support: $56.00–56.70
Resistance: $59.50–61.00
Volume: Accumulation spikes on green days
The chart shows a controlled pullback with no breakdown — just a retest of prior demand.
🎯 Trade Plan
Entry Zone: $57.00–57.60 (already hit)
Stop: $56.00 (below SMA + wick lows)
Target: $59.50–60.00
R/R: ~2:1 to 2.5:1
Alternate Setup: Add on a reclaim of $59 with volume for a continuation breakout
🧠 My Take
This is exactly the type of pullback I want — oversold RSI2, clean 50-SMA touch, rising trend, and the sector gaining momentum. As long as $56 holds, I like the bounce back into the $59–60 zone. Great structure for a short-duration swing.

ClearPoint Trading 🎯
Indicators • Education • Execution
whop.com/clearpointtrading | discord.gg/8sEwMnpz
Indicators • Education • Execution
whop.com/clearpointtrading | discord.gg/8sEwMnpz
Haftungsausschluss
Die Informationen und Veröffentlichungen sind nicht als Finanz-, Anlage-, Handels- oder andere Arten von Ratschlägen oder Empfehlungen gedacht, die von TradingView bereitgestellt oder gebilligt werden, und stellen diese nicht dar. Lesen Sie mehr in den Nutzungsbedingungen.
ClearPoint Trading 🎯
Indicators • Education • Execution
whop.com/clearpointtrading | discord.gg/8sEwMnpz
Indicators • Education • Execution
whop.com/clearpointtrading | discord.gg/8sEwMnpz
Haftungsausschluss
Die Informationen und Veröffentlichungen sind nicht als Finanz-, Anlage-, Handels- oder andere Arten von Ratschlägen oder Empfehlungen gedacht, die von TradingView bereitgestellt oder gebilligt werden, und stellen diese nicht dar. Lesen Sie mehr in den Nutzungsbedingungen.