
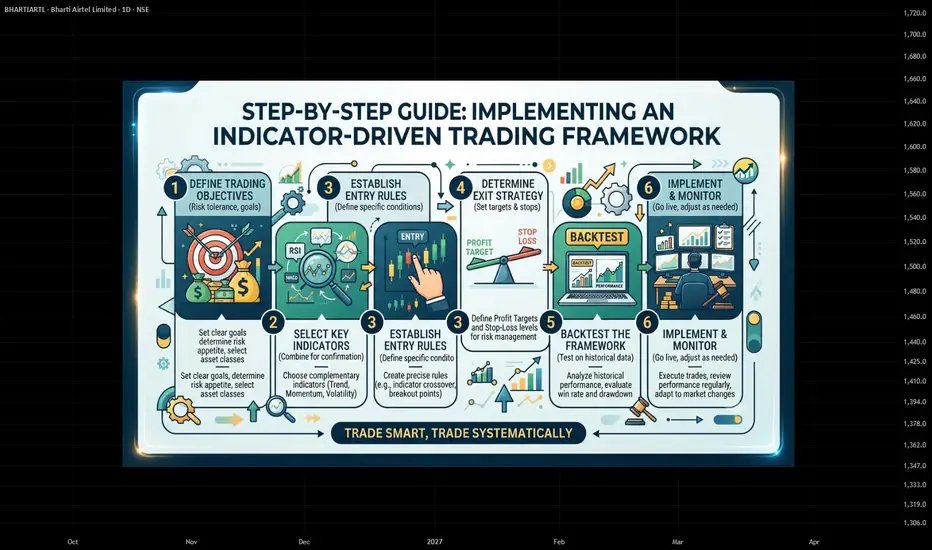
🔎 Step-by-Step Guide: Implementing an Indicator-Driven Trading Framework
------------------------------
➡️ Step 1: Establish Your Market Bias (Trend Identification)
Before looking for entries, you must identify the market's overall direction to avoid trading against institutional momentum.
* Use a trend indicator like the Exponential Moving Average (EMA) (e.g., 50-period or 200-period).
* Action: Only look for buy setups if the price is above the EMA, and only look for short setups if the price is below the EMA. This removes visual guesswork about the trend.
------------------------------
➡️ Step 2: Measure Market Volatility (Risk Parameter Definition)
Markets constantly shift between high and low volatility. Your risk parameters must mathematically adapt to these changes so your trades have room to breathe.
* Use a volatility indicator like the Average True Range (ATR) or Bollinger Bands.
* Action: Check the current ATR value. Use a multiple of this value (e.g., 1.5x or 2x ATR) to determine the distance of your stop-loss from your entry point. This ensures your stop-loss is placed safely outside normal market noise.
------------------------------
➡️ Step 3: Wait for Confluence (The Strict Entry Checklist)
Avoid chasing sudden price spikes or giving into FOMO. Establish a multi-factor checklist that must be fully satisfied before risking capital.
* Combine your trend indicator with a momentum oscillator like the Relative Strength Index (RSI) or Stochastic Oscillator.
* Action: Execute a trade only when your conditions align simultaneously. For example: Price is above the 50 EMA (Trend) AND the RSI pulls back below 30 then crosses back up (Momentum is oversold but recovering). If one condition is missing, no trade is taken.
------------------------------
➡️ Step 4: Synthesize Volume and Institutional Order Flow
Validate price movements by confirming whether big institutional players are participating in the move.
* Use volume-based indicators like the Volume Weighted Average Price (VWAP) or liquidity heatmaps.
* Action: For a long setup, ensure the price is holding above the VWAP, which indicates institutional buyers are supporting the current price levels.
------------------------------
➡️ Step 5: Run a Historical Audit (Strategic Backtesting)
Never risk real capital based on a gut feeling. Since indicators rely on rigid mathematical formulas, you can audit your exact strategy before trading live.
* Action: Plug your exact indicator rules (from Steps 1 to 4) into a charting platform's backtesting software. Run the parameters against years of historical data to verify the strategy's win rate, profit factor, and maximum historical drawdown.
------------------------------
➡️ Step 6: Automate or Standardise Execution
Strip away emotional traps like hesitation, panic-selling, or revenge trading by turning your execution into a binary process.
* Action: Set up automated alerts or coded orders that trigger the exact millisecond your indicator parameters cross. The data will dictate your exit or entry—leaving no room for human analytical paralysis.
------------------------------
➡️ Step 1: Establish Your Market Bias (Trend Identification)
Before looking for entries, you must identify the market's overall direction to avoid trading against institutional momentum.
* Use a trend indicator like the Exponential Moving Average (EMA) (e.g., 50-period or 200-period).
* Action: Only look for buy setups if the price is above the EMA, and only look for short setups if the price is below the EMA. This removes visual guesswork about the trend.
------------------------------
➡️ Step 2: Measure Market Volatility (Risk Parameter Definition)
Markets constantly shift between high and low volatility. Your risk parameters must mathematically adapt to these changes so your trades have room to breathe.
* Use a volatility indicator like the Average True Range (ATR) or Bollinger Bands.
* Action: Check the current ATR value. Use a multiple of this value (e.g., 1.5x or 2x ATR) to determine the distance of your stop-loss from your entry point. This ensures your stop-loss is placed safely outside normal market noise.
------------------------------
➡️ Step 3: Wait for Confluence (The Strict Entry Checklist)
Avoid chasing sudden price spikes or giving into FOMO. Establish a multi-factor checklist that must be fully satisfied before risking capital.
* Combine your trend indicator with a momentum oscillator like the Relative Strength Index (RSI) or Stochastic Oscillator.
* Action: Execute a trade only when your conditions align simultaneously. For example: Price is above the 50 EMA (Trend) AND the RSI pulls back below 30 then crosses back up (Momentum is oversold but recovering). If one condition is missing, no trade is taken.
------------------------------
➡️ Step 4: Synthesize Volume and Institutional Order Flow
Validate price movements by confirming whether big institutional players are participating in the move.
* Use volume-based indicators like the Volume Weighted Average Price (VWAP) or liquidity heatmaps.
* Action: For a long setup, ensure the price is holding above the VWAP, which indicates institutional buyers are supporting the current price levels.
------------------------------
➡️ Step 5: Run a Historical Audit (Strategic Backtesting)
Never risk real capital based on a gut feeling. Since indicators rely on rigid mathematical formulas, you can audit your exact strategy before trading live.
* Action: Plug your exact indicator rules (from Steps 1 to 4) into a charting platform's backtesting software. Run the parameters against years of historical data to verify the strategy's win rate, profit factor, and maximum historical drawdown.
------------------------------
➡️ Step 6: Automate or Standardise Execution
Strip away emotional traps like hesitation, panic-selling, or revenge trading by turning your execution into a binary process.
* Action: Set up automated alerts or coded orders that trigger the exact millisecond your indicator parameters cross. The data will dictate your exit or entry—leaving no room for human analytical paralysis.

Sucrit.D.Patil
Haftungsausschluss
Die Informationen und Veröffentlichungen sind nicht als Finanz-, Anlage-, Handels- oder andere Arten von Ratschlägen oder Empfehlungen gedacht, die von TradingView bereitgestellt oder gebilligt werden, und stellen diese nicht dar. Lesen Sie mehr in den Nutzungsbedingungen.