
BHARTIARTL — Descending Triangle Testing Breakout on Daily Chart
Overview
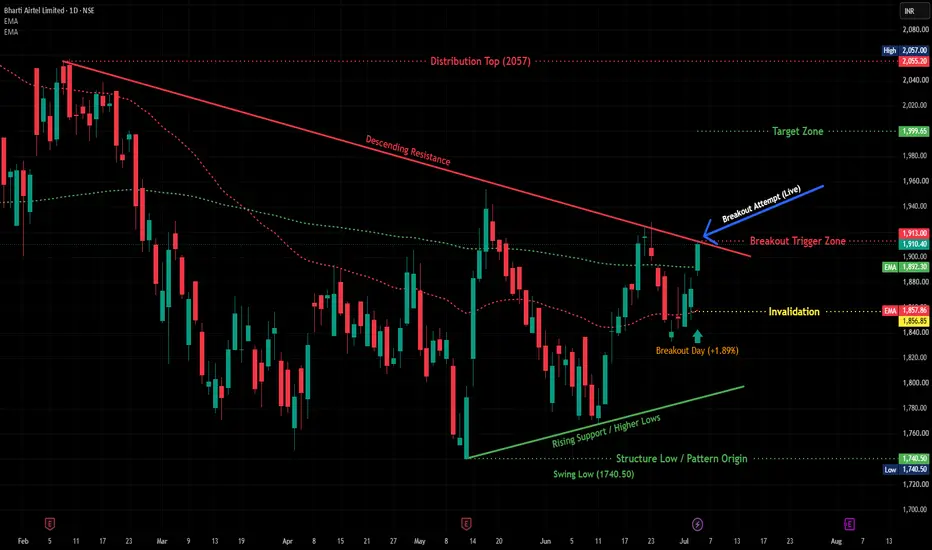
Bharti Airtel has spent the last five months carving out a textbook descending triangle on the daily chart, and today's session is where it starts getting interesting. Price rallied 1.89% off a strong base, pushing right into the resistance line that's been capping every rally since February. If this holds, we could be looking at the start of a fresh leg higher after months of range-bound grinding.
Pattern Explanation
The structure here is clean: a descending resistance line connecting the February high (2057) down through a series of lower highs, meeting a rising support line built off higher lows since the May bottom (1740.50). That's a classic descending triangle — lower highs compressing into a flat-ish floor, which usually resolves in the direction of the prevailing higher-low structure once broken.
Today's candle closed right at the confluence of that resistance line and the 1910-1913 zone, which has acted as a pivot multiple times since June. This is the first real test of the trendline with strong volume and price momentum behind it, not just a wick poking through.
Key Levels
Breakout Trigger Zone: 1910–1913
Invalidation: 1856.85 (below recent swing structure)
Target Zone: 1999.65
Structure Low / Pattern Origin: 1740.50
Distribution Top: 2057
Risk-to-reward from current levels works out to roughly 1:1.7, which is a reasonable setup for anyone tracking this on the daily timeframe.
Scenarios
Bullish scenario: A daily close above 1913 with follow-through volume opens the door toward 1980, and eventually the 1999–2000 target zone. Watch how price behaves around the 1940-1960 area — that's where the 200 EMA region previously acted as resistance during the March-April decline, so some hesitation there wouldn't be surprising.
Bearish scenario: If price fails to hold above 1910 and slips back under the rising support line (currently tracking near 1885-1890), the triangle thesis weakens and a retest of 1856-1860 becomes likely. A break below 1856.85 would invalidate the setup entirely and put the May-June range lows back in play.
Beginner's Lesson
A descending triangle is one of the more reliable continuation/reversal patterns to learn because it tells you two things at once: sellers are getting weaker (lower highs, but shallower each time) while buyers are getting stronger (higher lows). When those two lines converge, it's usually a sign that a decisive move is close. The key skill isn't spotting the pattern — it's waiting for the actual break with volume, rather than jumping in on the first touch of the resistance line. Airtel gave several false pokes at this trendline back in May and June that faded; today's move has more conviction behind it, which is what separates a real breakout attempt from noise.
Conclusion
Bharti Airtel is at a genuine decision point after months of consolidation. The structure is clean, the levels are well-defined, and today's price action gives the bulls their strongest case yet. As always, this is for educational and analytical purposes — confirm with your own risk management and position sizing before acting, and keep an eye on the 1910-1913 zone over the next couple of sessions to see if this breakout has legs.
Not investment advice. For educational purposes only. Please consult your financial advisor before making any trading decisions.
Bharti Airtel has spent the last five months carving out a textbook descending triangle on the daily chart, and today's session is where it starts getting interesting. Price rallied 1.89% off a strong base, pushing right into the resistance line that's been capping every rally since February. If this holds, we could be looking at the start of a fresh leg higher after months of range-bound grinding.
Pattern Explanation
The structure here is clean: a descending resistance line connecting the February high (2057) down through a series of lower highs, meeting a rising support line built off higher lows since the May bottom (1740.50). That's a classic descending triangle — lower highs compressing into a flat-ish floor, which usually resolves in the direction of the prevailing higher-low structure once broken.
Today's candle closed right at the confluence of that resistance line and the 1910-1913 zone, which has acted as a pivot multiple times since June. This is the first real test of the trendline with strong volume and price momentum behind it, not just a wick poking through.
Key Levels
Breakout Trigger Zone: 1910–1913
Invalidation: 1856.85 (below recent swing structure)
Target Zone: 1999.65
Structure Low / Pattern Origin: 1740.50
Distribution Top: 2057
Risk-to-reward from current levels works out to roughly 1:1.7, which is a reasonable setup for anyone tracking this on the daily timeframe.
Scenarios
Bullish scenario: A daily close above 1913 with follow-through volume opens the door toward 1980, and eventually the 1999–2000 target zone. Watch how price behaves around the 1940-1960 area — that's where the 200 EMA region previously acted as resistance during the March-April decline, so some hesitation there wouldn't be surprising.
Bearish scenario: If price fails to hold above 1910 and slips back under the rising support line (currently tracking near 1885-1890), the triangle thesis weakens and a retest of 1856-1860 becomes likely. A break below 1856.85 would invalidate the setup entirely and put the May-June range lows back in play.
Beginner's Lesson
A descending triangle is one of the more reliable continuation/reversal patterns to learn because it tells you two things at once: sellers are getting weaker (lower highs, but shallower each time) while buyers are getting stronger (higher lows). When those two lines converge, it's usually a sign that a decisive move is close. The key skill isn't spotting the pattern — it's waiting for the actual break with volume, rather than jumping in on the first touch of the resistance line. Airtel gave several false pokes at this trendline back in May and June that faded; today's move has more conviction behind it, which is what separates a real breakout attempt from noise.
Conclusion
Bharti Airtel is at a genuine decision point after months of consolidation. The structure is clean, the levels are well-defined, and today's price action gives the bulls their strongest case yet. As always, this is for educational and analytical purposes — confirm with your own risk management and position sizing before acting, and keep an eye on the 1910-1913 zone over the next couple of sessions to see if this breakout has legs.
Not investment advice. For educational purposes only. Please consult your financial advisor before making any trading decisions.
Anmerkung
Update — Testing Resistance Zone, Original Setup Still Intact
Nice one to check back on, especially since this became an Editor's Pick. Since the original post, Bharti Airtel has held up well — price cleared the Breakout Trigger Zone (1,913) and is now testing a new level we're marking as a Resistance Zone around 1,953–1,954, currently trading at 1,940.
This new Resistance Zone comes from an old consolidation area on the chart — price paused and traded sideways around this level a few times earlier this year before moving on, which is why it's likely to act as a speed bump again now.
Where things stand:
Price is right at the Resistance Zone (1,953.8), a level between the original breakout trigger and the Target Zone (1,999.7)
Invalidation level (1,856.9) hasn't been touched — the setup remains valid
Rising support/higher lows structure is still intact below
What to watch next:
A close above 1,953–1,954 would open the path toward the original Target Zone at 1,999.7
If price fails here and slips back toward 1,913 or lower, that would suggest more consolidation before another attempt
Invalidation stays at 1,856.9 — no change needed there since price is well above it
Bottom line: the original breakout thesis is playing out well so far — no invalidation, and now testing the next resistance step before the final target. As always, waiting for a confirmed close above this zone before assuming the target is next.
For educational purposes only. Not financial advice. Always manage your risk.
Trade geschlossen: Ziel wurde erreicht
Update — Target Achieved ✅
Bharti Airtel delivered on the breakout thesis. Price broke above the 1910–1913 trigger zone as flagged, rallied through the 1940–1960 zone with only brief hesitation, and hit a high of 2,031 yesterday, comfortably clearing our 1999.65 target zone.
From the original breakout trigger to yesterday's high, that's a move of roughly 6%+, playing out over about a month.
What's happening now
Today's session saw some profit booking, with price pulling back to close at 1,948, right back into the old Resistance Zone (1,948–1,953.8), which is now acting as a support/pivot test. This is a normal cooldown after a strong run, not a failure of the setup.
What's next
The bigger level to watch is the 2,057 Distribution Top, the same zone that capped the last major top years ago. That remains the next real decision point:
A close back above 1,999–2,020 with fresh strength would keep the door open for a test of 2,057.
If price slips below 1,913 (the old breakout trigger, now support), it would suggest the move is done for now and a deeper consolidation phase may follow.
Lesson for the community
This is a good example of a full pattern cycle: descending triangle, clean breakout trigger, defined target, and a target actually reached — with price now digesting the move. The key takeaway is that after a target hits, it's normal and healthy for a stock to pull back and consolidate rather than run in a straight line. Chasing right after a big move without a fresh setup is usually not the best risk-reward.
Closing this update here. Will publish a fresh Idea if price gives a clean setup around the 1,913–2,057 zone.
This is for educational purposes only and not investment advice. Please do your own research or consult a financial advisor before making any trading decisions.

📈 HK Trading Community | Market Structure & Indicator Updates
Telegram: t.me/trendstrike1000
Website: quantumedgepro.netlify.app/
Real traders are built through learning,not tip hunting.So Start Learning How the Market Really Works
Telegram: t.me/trendstrike1000
Website: quantumedgepro.netlify.app/
Real traders are built through learning,not tip hunting.So Start Learning How the Market Really Works
Haftungsausschluss
Die Informationen und Veröffentlichungen sind nicht als Finanz-, Anlage-, Handels- oder andere Arten von Ratschlägen oder Empfehlungen gedacht, die von TradingView bereitgestellt oder gebilligt werden, und stellen diese nicht dar. Lesen Sie mehr in den Nutzungsbedingungen.
📈 HK Trading Community | Market Structure & Indicator Updates
Telegram: t.me/trendstrike1000
Website: quantumedgepro.netlify.app/
Real traders are built through learning,not tip hunting.So Start Learning How the Market Really Works
Telegram: t.me/trendstrike1000
Website: quantumedgepro.netlify.app/
Real traders are built through learning,not tip hunting.So Start Learning How the Market Really Works
Haftungsausschluss
Die Informationen und Veröffentlichungen sind nicht als Finanz-, Anlage-, Handels- oder andere Arten von Ratschlägen oder Empfehlungen gedacht, die von TradingView bereitgestellt oder gebilligt werden, und stellen diese nicht dar. Lesen Sie mehr in den Nutzungsbedingungen.