
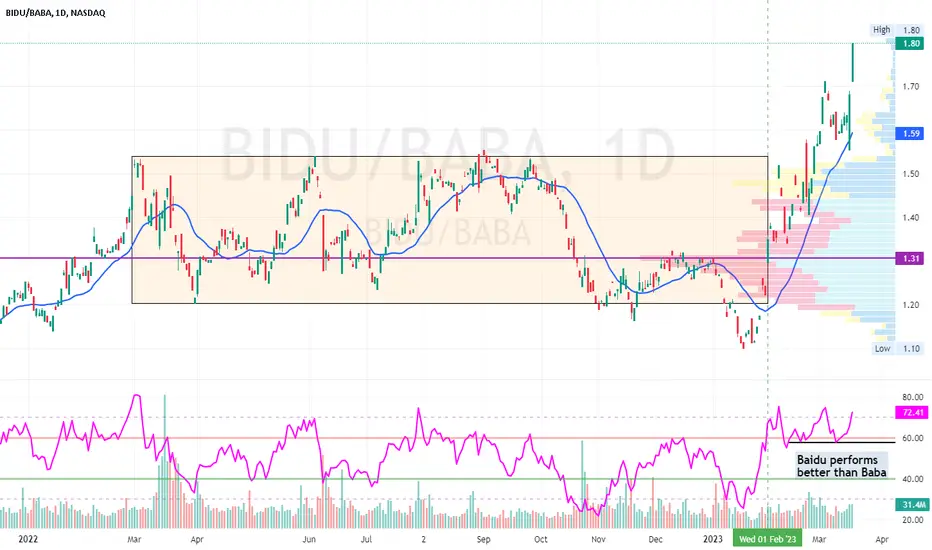
One year Daily Chart
a simple comparison by dividing #BIDU / #BABA
The ratio has been kept mostly within 1.20 ~ 1.5+
Daily RSI starts to surpass 60, which potentially starts a bullish move
*** in this case, meaning Baidu will potentially starts to outperform Baba for quite sometime)
The ratio finally surpass 1.50+ again and has since mark a new High
RSI continues to stays along high levels
so long RSI did not break below leveled support, Baidu will perform better than Baba
a simple comparison by dividing #BIDU / #BABA
The ratio has been kept mostly within 1.20 ~ 1.5+
Daily RSI starts to surpass 60, which potentially starts a bullish move
*** in this case, meaning Baidu will potentially starts to outperform Baba for quite sometime)
The ratio finally surpass 1.50+ again and has since mark a new High
RSI continues to stays along high levels
so long RSI did not break below leveled support, Baidu will perform better than Baba
Anmerkung
a total reversal! now Baba is better, ratio may gradualy drop back along 1.2 area
Haftungsausschluss
Die Informationen und Veröffentlichungen sind nicht als Finanz-, Anlage-, Handels- oder andere Arten von Ratschlägen oder Empfehlungen gedacht, die von TradingView bereitgestellt oder gebilligt werden, und stellen diese nicht dar. Lesen Sie mehr in den Nutzungsbedingungen.
Haftungsausschluss
Die Informationen und Veröffentlichungen sind nicht als Finanz-, Anlage-, Handels- oder andere Arten von Ratschlägen oder Empfehlungen gedacht, die von TradingView bereitgestellt oder gebilligt werden, und stellen diese nicht dar. Lesen Sie mehr in den Nutzungsbedingungen.