Long
BLOKUSDT
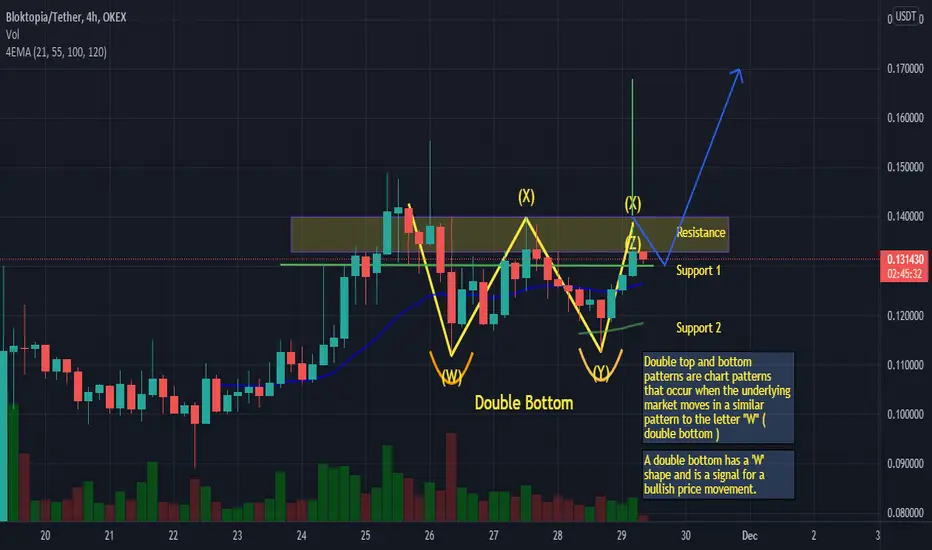
Double top and bottom patterns are chart patterns that occur when the underlying market moves in a similar pattern to the letter "W" ( double bottom )
A double bottom has a 'W' shape and is a signal for a bullish price movement.
If BLOK breaks R1 Region 0.13000-0.14000
Then
it can go to 0.17000-0.20000
A double bottom has a 'W' shape and is a signal for a bullish price movement.
If BLOK breaks R1 Region 0.13000-0.14000
Then
it can go to 0.17000-0.20000

Haftungsausschluss
Die Informationen und Veröffentlichungen sind nicht als Finanz-, Anlage-, Handels- oder andere Arten von Ratschlägen oder Empfehlungen gedacht, die von TradingView bereitgestellt oder gebilligt werden, und stellen diese nicht dar. Lesen Sie mehr in den Nutzungsbedingungen.
Haftungsausschluss
Die Informationen und Veröffentlichungen sind nicht als Finanz-, Anlage-, Handels- oder andere Arten von Ratschlägen oder Empfehlungen gedacht, die von TradingView bereitgestellt oder gebilligt werden, und stellen diese nicht dar. Lesen Sie mehr in den Nutzungsbedingungen.