
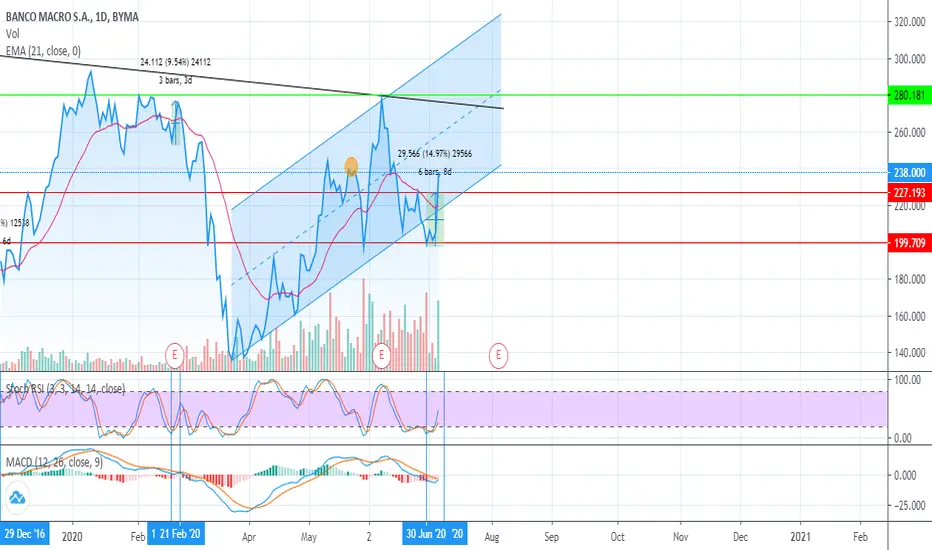
The chart analyses short-term pricing after comparing a 21 EMA bullish trend, 30/50 RSI values, and MACD trends immediately before changing its convergence to overselling, considering moderate volume. These conditions were met seven times between 2016 and 2020, with an average of 15,57% increase in stock price within a span of 9 days on average. In the current case, the starting point is set on 30 June ($198) and ending July 8, before Argentina's Independence Day (July 9 and 10 are free days).
I'd suggest selling immediately after the market opens on July 07 (and rebuying when price reaches around $228 on July 08). The current price ($238) could be a consider a resistance, as prices have dropped from there two times before (see orange circles).
I'd suggest selling immediately after the market opens on July 07 (and rebuying when price reaches around $228 on July 08). The current price ($238) could be a consider a resistance, as prices have dropped from there two times before (see orange circles).

Haftungsausschluss
Die Informationen und Veröffentlichungen sind nicht als Finanz-, Anlage-, Handels- oder andere Arten von Ratschlägen oder Empfehlungen gedacht, die von TradingView bereitgestellt oder gebilligt werden, und stellen diese nicht dar. Lesen Sie mehr in den Nutzungsbedingungen.
Haftungsausschluss
Die Informationen und Veröffentlichungen sind nicht als Finanz-, Anlage-, Handels- oder andere Arten von Ratschlägen oder Empfehlungen gedacht, die von TradingView bereitgestellt oder gebilligt werden, und stellen diese nicht dar. Lesen Sie mehr in den Nutzungsbedingungen.