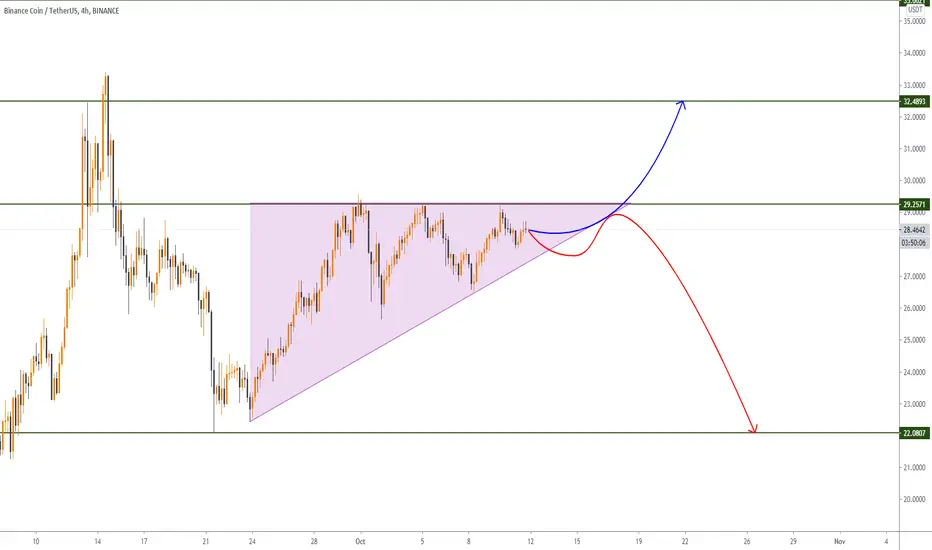

 BNBUSDT
Hello everyone.
As we can see :
- EMAs 20/50 are acting as support
- RSI is neutral
- Stochastic RSI is going into overbought zone again
- MACD is narrow and somehow neutral
- Helical indicator is bullish but its going to catch bearish movement
- Top flat triangle
- Invert Head & shoulders
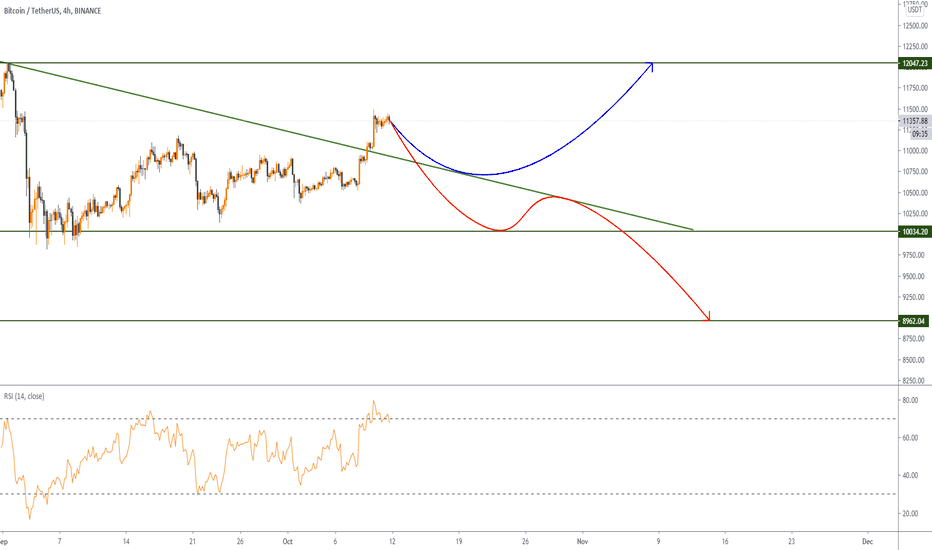
I expect a retest from triangle support and a breakout from resistance, but as I mention in last analysis ( BTC/USDT ).
I wont suggest to take long-term position until 13th October !!
Also there is a chance to reject from triangle, watch for it.
Here is the BTC/USDT analysis :
Attention : this is not a financial advise we just try to help people on their own vision.
HAVE A GOOD DAY
- Helical_Trades

Verbundene Veröffentlichungen
Haftungsausschluss
Die Informationen und Veröffentlichungen sind nicht als Finanz-, Anlage-, Handels- oder andere Arten von Ratschlägen oder Empfehlungen gedacht, die von TradingView bereitgestellt oder gebilligt werden, und stellen diese nicht dar. Lesen Sie mehr in den Nutzungsbedingungen.
Verbundene Veröffentlichungen
Haftungsausschluss
Die Informationen und Veröffentlichungen sind nicht als Finanz-, Anlage-, Handels- oder andere Arten von Ratschlägen oder Empfehlungen gedacht, die von TradingView bereitgestellt oder gebilligt werden, und stellen diese nicht dar. Lesen Sie mehr in den Nutzungsbedingungen.