
📌 Market Structure
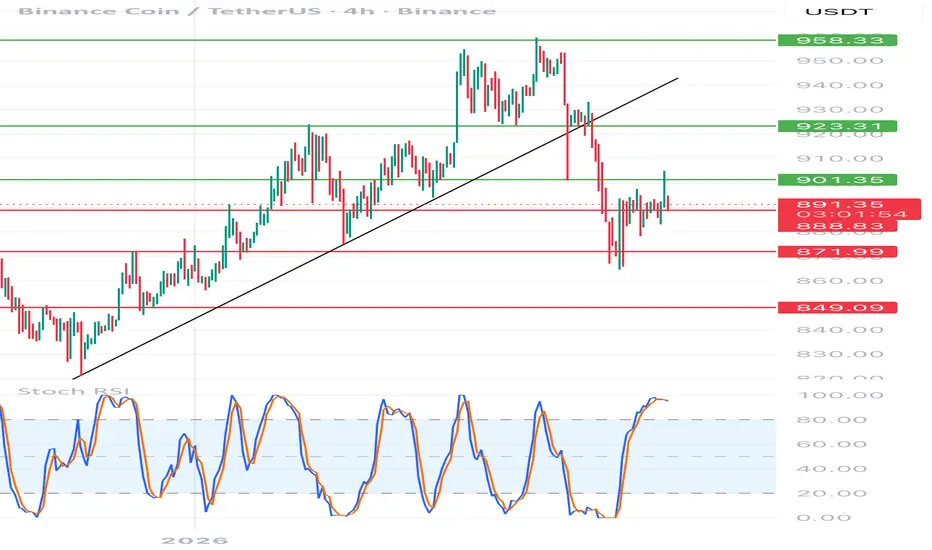
• The uptrend has been broken – a clear breakout of the black trend line + an impulsive decline.
• Currently consolidating after a drop → a classic bear flag/base after a downward impulse.
• The market is in a decision phase, not in a trend.
⸻
🟥 Key Levels
🔴 Support
• 890–888 → current fighting zone (local HL after dump)
• 872 → very important support (if broken → acceleration of the decline)
• 849 → last line of defense for the bulls
🟢 Resistance
• 901 → first resistance (local LH)
• 923 → strong S/R flip (this is where the avalanche began)
• 958 → key structural resistance (return to bullish scenario)
⸻
📉 Momentum & RSI
• Stochastic RSI:
• High/overbought → weak fuel for growth
• Typical spot for a recoil or false breakout
• No bullish divergence → no signal yet Reversals
⸻
🎯 Scenarios
🐻 Baseline Scenario (more likely)
• Recoil from 890–901
• Pullback to 872
• If 872 breaks on volume → quick move to 849
➡️ This is a classic pullback → continuation
⸻
🐂 Alternative (conditional) Scenario
• Defense 888–890
• Breakout of 901 + close of the 4-hour candle
• Retest of 901 as support
• Target: 923, and only then consider 958
➡️ Without a breakout of 901, there is no way the uptrend will resume
• The uptrend has been broken – a clear breakout of the black trend line + an impulsive decline.
• Currently consolidating after a drop → a classic bear flag/base after a downward impulse.
• The market is in a decision phase, not in a trend.
⸻
🟥 Key Levels
🔴 Support
• 890–888 → current fighting zone (local HL after dump)
• 872 → very important support (if broken → acceleration of the decline)
• 849 → last line of defense for the bulls
🟢 Resistance
• 901 → first resistance (local LH)
• 923 → strong S/R flip (this is where the avalanche began)
• 958 → key structural resistance (return to bullish scenario)
⸻
📉 Momentum & RSI
• Stochastic RSI:
• High/overbought → weak fuel for growth
• Typical spot for a recoil or false breakout
• No bullish divergence → no signal yet Reversals
⸻
🎯 Scenarios
🐻 Baseline Scenario (more likely)
• Recoil from 890–901
• Pullback to 872
• If 872 breaks on volume → quick move to 849
➡️ This is a classic pullback → continuation
⸻
🐂 Alternative (conditional) Scenario
• Defense 888–890
• Breakout of 901 + close of the 4-hour candle
• Retest of 901 as support
• Target: 923, and only then consider 958
➡️ Without a breakout of 901, there is no way the uptrend will resume

Haftungsausschluss
Die Informationen und Veröffentlichungen sind nicht als Finanz-, Anlage-, Handels- oder andere Arten von Ratschlägen oder Empfehlungen gedacht, die von TradingView bereitgestellt oder gebilligt werden, und stellen diese nicht dar. Lesen Sie mehr in den Nutzungsbedingungen.
Haftungsausschluss
Die Informationen und Veröffentlichungen sind nicht als Finanz-, Anlage-, Handels- oder andere Arten von Ratschlägen oder Empfehlungen gedacht, die von TradingView bereitgestellt oder gebilligt werden, und stellen diese nicht dar. Lesen Sie mehr in den Nutzungsbedingungen.