
NeuPortal | BNB 24h - core 588-600, and only 26 real windows
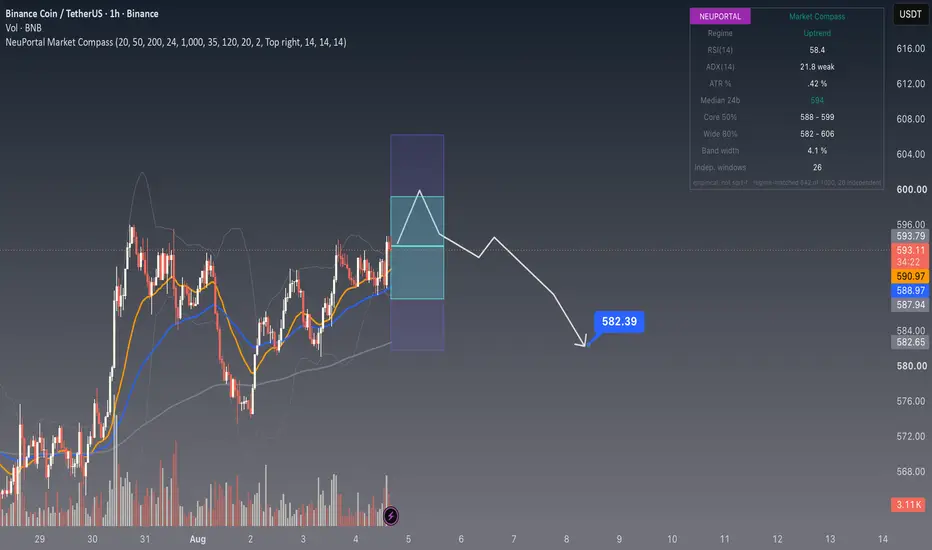
xxEvery number below is a quantile of what BNB has already done over the following 24 one-hour bars. Read from history, not from a formula, which is why the panel prints empirical, not sqrt-t along its bottom edge.
Median 594
Core 50% 588 - 600
Wide 80% 582 - 607
Band width 4.1% of spot
THIS ONE DID NOT FALL BACK
We ask the sample a narrow question: show me only the windows that opened in conditions resembling the ones on screen right now. Some instruments cannot answer it. Two we published earlier today had to revert to the full unconditional sample because too few windows matched.
Here 643 of 1,000 matched. The regime filter did the job it exists for, and the band above describes an uptrend with weak momentum rather than an average of every market state BNB has ever been in.
AND HERE IS WHAT THAT COST
Independent windows: 26.
Those two figures belong in the same sentence. Overlapping windows share 23 of their 24 bars, so 643 matched windows are nothing like 643 observations. Strip the overlap and 26 is what remains, and quantile error bars scale with 26 rather than with 643.
So the choice is not between a good band and a bad one. An unconditional read keeps roughly 125 independent windows and pays by importing every regime, calm and violent alike, into a single number. A conditioned read keeps today's regime and hands you 26 observations to estimate a tail from. We print both figures because picking one and hiding the other is how a band starts looking more authoritative than it is.
THE PANEL CONTRADICTS ITSELF, AND THAT IS WORTH SAYING
Regime reads Uptrend. ADX prints 21.8, which is weak by any conventional threshold. Those two do not agree, and I would rather point at it than let a reader find it.
RSI at 59.8 is mildly constructive and nowhere near extended. ATR is 0.42% per bar. A trend classification with weak trend strength behind it is a trend that has not proven anything yet, and when the labels disagree the width is the part of this chart worth reading.
NO DIRECTIONAL LEAN
Median 594 against spot 593.59 - seven hundredths of a per cent above, which is to say nothing. The regime label leans up, the momentum reading does not confirm it, and the distribution declines to take a side. Published that way rather than rounded into a story.
This describes a distance over a horizon, with its sample size printed next to it. No entry, no target, no stop.
Educational content - not financial advice.
Median 594
Core 50% 588 - 600
Wide 80% 582 - 607
Band width 4.1% of spot
THIS ONE DID NOT FALL BACK
We ask the sample a narrow question: show me only the windows that opened in conditions resembling the ones on screen right now. Some instruments cannot answer it. Two we published earlier today had to revert to the full unconditional sample because too few windows matched.
Here 643 of 1,000 matched. The regime filter did the job it exists for, and the band above describes an uptrend with weak momentum rather than an average of every market state BNB has ever been in.
AND HERE IS WHAT THAT COST
Independent windows: 26.
Those two figures belong in the same sentence. Overlapping windows share 23 of their 24 bars, so 643 matched windows are nothing like 643 observations. Strip the overlap and 26 is what remains, and quantile error bars scale with 26 rather than with 643.
So the choice is not between a good band and a bad one. An unconditional read keeps roughly 125 independent windows and pays by importing every regime, calm and violent alike, into a single number. A conditioned read keeps today's regime and hands you 26 observations to estimate a tail from. We print both figures because picking one and hiding the other is how a band starts looking more authoritative than it is.
THE PANEL CONTRADICTS ITSELF, AND THAT IS WORTH SAYING
Regime reads Uptrend. ADX prints 21.8, which is weak by any conventional threshold. Those two do not agree, and I would rather point at it than let a reader find it.
RSI at 59.8 is mildly constructive and nowhere near extended. ATR is 0.42% per bar. A trend classification with weak trend strength behind it is a trend that has not proven anything yet, and when the labels disagree the width is the part of this chart worth reading.
NO DIRECTIONAL LEAN
Median 594 against spot 593.59 - seven hundredths of a per cent above, which is to say nothing. The regime label leans up, the momentum reading does not confirm it, and the distribution declines to take a side. Published that way rather than rounded into a story.
This describes a distance over a horizon, with its sample size printed next to it. No entry, no target, no stop.
Educational content - not financial advice.
Anmerkung
Update on the drawn path, two days in.To be clear about what is being tracked here, because this chart carries two separate objects. The band and the median come from the indicator and describe a 24-hour horizon. The grey line is a hand-drawn path with its own endpoint and its own date, running to 10 August. They resolve on different clocks and should be scored separately.
The path called a peak first, then a decline, then a bounce, then a further decline. In order, that is what happened: the high printed at 605.50 on 5 August at 02:00 UTC, the low at 591.79 on the 5th at 23:00, the bounce reached 598.32 on the 6th at 05:00, and the next leg down has taken it to 593.35 this morning. Four turns, in sequence.
The part that is not yet decided is the only part that can be scored. The line ends at 582.39 and price sits 1.93% above it with four days left on the horizon. Nothing about the shape so far settles that.
And a caution I would rather write myself than have written underneath: a path with one peak and one trough will look correct against almost any market that does not move in a straight line. Shape agreement is weak evidence and it feels much stronger than it is. The endpoint and the date are the falsifiable parts, and both are still open.
Educational content - not financial advice.
Trade geschlossen: Stop wurde erreicht
Closing this short as a miss. The stop side got hit, not the target.The idea leaned short from the 594 median toward 582. Price did the opposite. After a shallow early dip that bottomed at 585.30, never reaching the 582 objective, BNB turned up and ran to 620.55, breaking clean above the 606 top of the band. That is a full upside invalidation. It now sits near 607, a couple of percent above where the short was framed.
The title flagged the weak spot itself: only 26 regime-matched windows behind this band. A thin sample is a thin sample, and this is what that risk looks like when it bites - the range did not hold on the upside.
Scoring it a loss and leaving it up. The whole point of doing this in the open is that the misses stay on the same page as the hits.
Levels were fixed and hashed at publication, before any of this.
Educational content - not financial advice.

Haftungsausschluss
Die Informationen und Veröffentlichungen sind nicht als Finanz-, Anlage-, Handels- oder andere Arten von Ratschlägen oder Empfehlungen gedacht, die von TradingView bereitgestellt oder gebilligt werden, und stellen diese nicht dar. Lesen Sie mehr in den Nutzungsbedingungen.
Haftungsausschluss
Die Informationen und Veröffentlichungen sind nicht als Finanz-, Anlage-, Handels- oder andere Arten von Ratschlägen oder Empfehlungen gedacht, die von TradingView bereitgestellt oder gebilligt werden, und stellen diese nicht dar. Lesen Sie mehr in den Nutzungsbedingungen.