 Binance Coin / TetherUSAktualisiert
 BNB/USDT Technical Analysis: Potential Head and Shoulders Revers
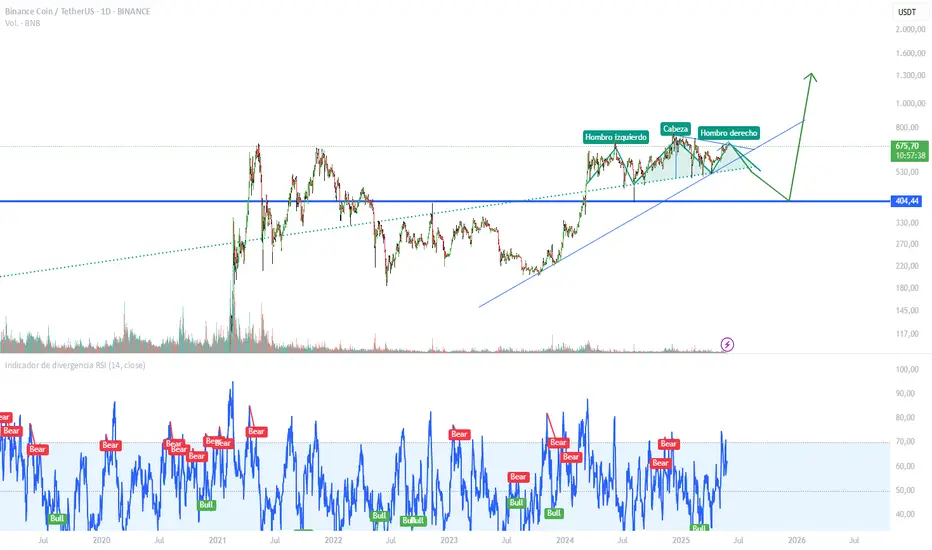
The BNB/USDT daily chart appears to be forming a classic Head and Shoulders (H&S) topping pattern, signaling a potential bearish reversal after its significant uptrend. The structure clearly defines a "Left Shoulder," a higher "Head" (peaking near $800), and a subsequent "Right Shoulder" that aligns in height with the left. The critical element is the upward-sloping neckline, defined by the trendline connecting the lows between the shoulders.
A confirmed breakdown below this neckline, ideally supported by increased selling volume, would validate the H&S pattern. The traditional price target for this pattern is calculated by measuring the vertical distance from the Head's peak to the neckline and projecting it downwards from the breakout point. This suggests a potential downside move towards the significant horizontal support around the $404.44 level, or even lower, as indicated by the chart's projection. Traders would monitor volume profile and RSI behavior for confirmation of the breakout, as a decisive close below the neckline would strongly indicate a shift from bullish momentum to a protracted bearish phase.
A confirmed breakdown below this neckline, ideally supported by increased selling volume, would validate the H&S pattern. The traditional price target for this pattern is calculated by measuring the vertical distance from the Head's peak to the neckline and projecting it downwards from the breakout point. This suggests a potential downside move towards the significant horizontal support around the $404.44 level, or even lower, as indicated by the chart's projection. Traders would monitor volume profile and RSI behavior for confirmation of the breakout, as a decisive close below the neckline would strongly indicate a shift from bullish momentum to a protracted bearish phase.
Trade ist aktiv

Haftungsausschluss
Die Informationen und Veröffentlichungen sind nicht als Finanz-, Anlage-, Handels- oder andere Arten von Ratschlägen oder Empfehlungen gedacht, die von TradingView bereitgestellt oder gebilligt werden, und stellen diese nicht dar. Lesen Sie mehr in den Nutzungsbedingungen.
Haftungsausschluss
Die Informationen und Veröffentlichungen sind nicht als Finanz-, Anlage-, Handels- oder andere Arten von Ratschlägen oder Empfehlungen gedacht, die von TradingView bereitgestellt oder gebilligt werden, und stellen diese nicht dar. Lesen Sie mehr in den Nutzungsbedingungen.