
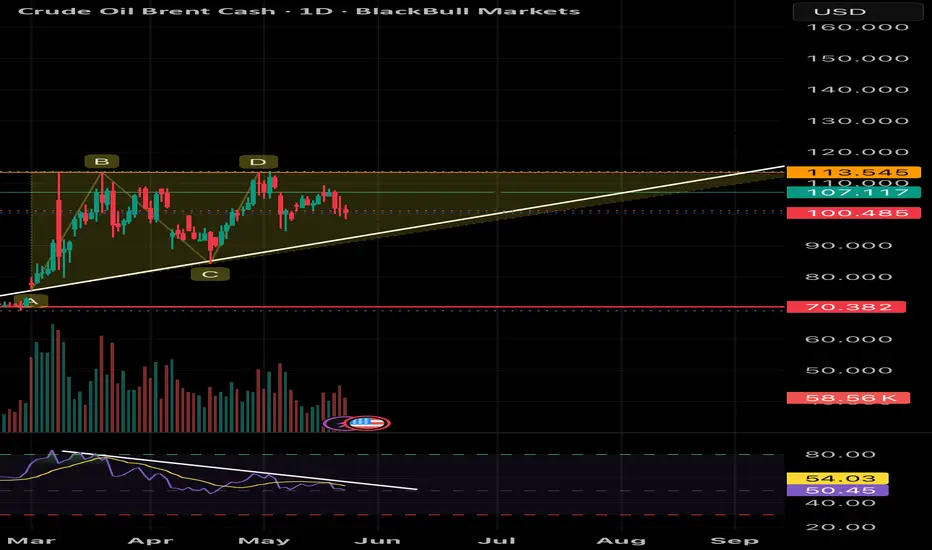
Brent Crude Oil – Daily Time Frame Analysis 📊
Brent Crude continues to trade inside a broader bullish structure while respecting a long-term rising trendline from March lows. However, momentum is slowing near the major supply zone around 113–114.
🔹 Key Observations:
• Price is forming higher lows, indicating buyers are still active.
• Strong resistance seen near 113.5 where multiple rejections occurred.
• Current price around 100 is trading close to trendline support.
• RSI shows a mild bearish divergence with lower highs, suggesting weakening momentum.
📌 Important Levels:
➡ Resistance:
• 107.1 – Immediate hurdle
• 113.5 – Major breakout zone
➡ Support:
• 99–97 – Crucial short-term support
• 90 – Next strong support if breakdown occurs
• 70.3 – Major long-term support
📈 Bullish Scenario:
A strong close above 107 can revive bullish momentum, while a breakout above 113.5 with volume may trigger a fresh rally toward 120+ levels.
📉 Bearish Scenario:
Failure to hold the rising trendline and breakdown below 97 may lead to deeper correction toward 90 levels.
Overall, the structure remains cautiously bullish until the trendline breaks, but RSI divergence indicates momentum compression and traders should watch for a decisive breakout or breakdown from this range.
Disclaimer: This analysis is for educational purposes only and not financial advice. Please do your own research before taking any trade.
Brent Crude continues to trade inside a broader bullish structure while respecting a long-term rising trendline from March lows. However, momentum is slowing near the major supply zone around 113–114.
🔹 Key Observations:
• Price is forming higher lows, indicating buyers are still active.
• Strong resistance seen near 113.5 where multiple rejections occurred.
• Current price around 100 is trading close to trendline support.
• RSI shows a mild bearish divergence with lower highs, suggesting weakening momentum.
📌 Important Levels:
➡ Resistance:
• 107.1 – Immediate hurdle
• 113.5 – Major breakout zone
➡ Support:
• 99–97 – Crucial short-term support
• 90 – Next strong support if breakdown occurs
• 70.3 – Major long-term support
📈 Bullish Scenario:
A strong close above 107 can revive bullish momentum, while a breakout above 113.5 with volume may trigger a fresh rally toward 120+ levels.
📉 Bearish Scenario:
Failure to hold the rising trendline and breakdown below 97 may lead to deeper correction toward 90 levels.
Overall, the structure remains cautiously bullish until the trendline breaks, but RSI divergence indicates momentum compression and traders should watch for a decisive breakout or breakdown from this range.
Disclaimer: This analysis is for educational purposes only and not financial advice. Please do your own research before taking any trade.

Haftungsausschluss
Die Informationen und Veröffentlichungen sind nicht als Finanz-, Anlage-, Handels- oder andere Arten von Ratschlägen oder Empfehlungen gedacht, die von TradingView bereitgestellt oder gebilligt werden, und stellen diese nicht dar. Lesen Sie mehr in den Nutzungsbedingungen.
Haftungsausschluss
Die Informationen und Veröffentlichungen sind nicht als Finanz-, Anlage-, Handels- oder andere Arten von Ratschlägen oder Empfehlungen gedacht, die von TradingView bereitgestellt oder gebilligt werden, und stellen diese nicht dar. Lesen Sie mehr in den Nutzungsbedingungen.