
BRENT CRUDE OIL ANALYSIS – MAY 13, 2026
Bullish Continuation & Fibonacci Extension Setup
Executive Summary
Brent is trading at
104.985
∗
∗
o
n
t
h
e
m
o
n
t
h
l
y
t
i
m
e
f
r
a
m
e
,
c
o
n
s
o
l
i
d
a
t
i
n
g
w
i
t
h
i
n
a
s
t
r
o
n
g
b
u
l
l
i
s
h
c
h
a
n
n
e
l
a
f
t
e
r
a
s
h
a
r
p
r
a
l
l
y
t
r
i
g
g
e
r
e
d
b
y
t
h
e
∗
∗
U
S
A
−
I
r
a
n
c
o
n
f
l
i
c
t
e
s
c
a
l
a
t
i
o
n
i
n
e
a
r
l
y
M
a
r
c
h
2026
∗
∗
.
T
h
e
p
r
i
c
e
i
s
c
u
r
r
e
n
t
l
y
c
o
i
l
i
n
g
b
e
l
o
w
a
c
r
i
t
i
c
a
l
b
r
e
a
k
o
u
t
z
o
n
e
n
e
a
r
∗
∗
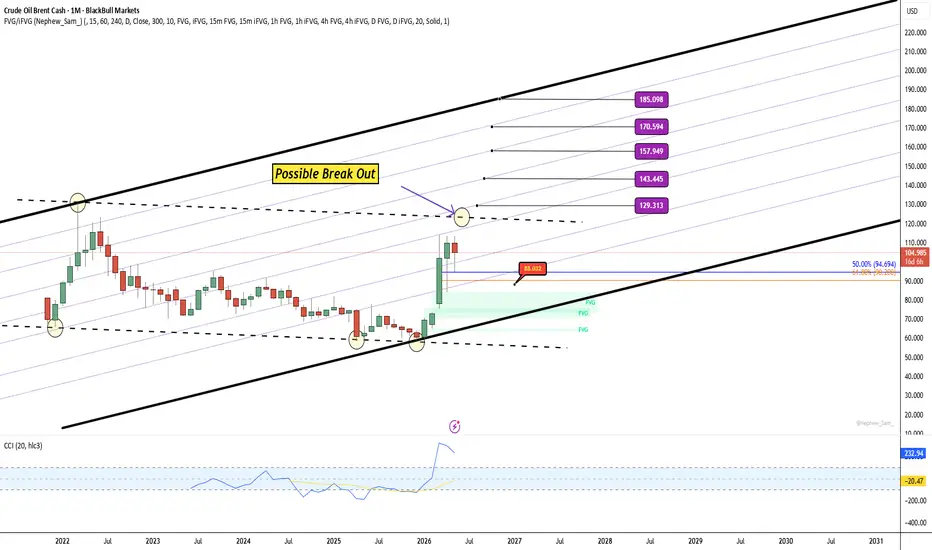
104.985∗∗onthemonthlytimeframe,consolidatingwithinastrongbullishchannelafterasharprallytriggeredbythe∗∗USA−IranconflictescalationinearlyMarch2026∗∗.Thepriceiscurrentlycoilingbelowacriticalbreakoutzonenear∗∗123. The CCI (20, hlc3) has corrected from an extreme peak of 324 down to 232, which historically indicates a healthy overbought reset within a strong uptrend, not a reversal.
Verdict: The breakout is imminent. The first confirmation will be a daily close above $129, which should trigger acceleration toward the Fibonacci extension targets: 143, 157, 170, and 185 USD.
Stop Loss:
88
∗
∗
E
n
t
r
y
∗
∗
:
88∗∗Entry∗∗:104.985 (current)
1. Geopolitical Context – USA / Iran Conflict (Updated May 2026)
The first confrontation occurred in early March 2026.
Since then, the situation has not de-escalated. On the contrary:
Strait of Hormuz remains partially blocked or under high military alert. Approximately 20% of global oil transit is disrupted.
The Trump administration has rejected new Iranian proposals as of early May. Statements from Washington indicate that "military options remain on the table."
Israel has conducted preemptive strikes against Iranian proxies in Syria (May 10–12, 2026).
OPEC production is at its lowest in 20 years due to sanctions and direct conflict impacts on loading terminals.
Market consensus (Bloomberg, Reuters, May 13):
*"The risk of a full-scale war has risen to 60–70% for Q3 2026. A peace deal before June is now highly unlikely."*
→ This creates a persistent geopolitical risk premium that will not fade quickly. The only catalyst for a sharp drop below $88 would be a surprise peace accord, which contradicts current headlines.
2. Technical Analysis – Monthly Timeframe
Your chart shows a clean bullish channel from the 2020–2023 lows. The price has already broken above the 0.786 Fibonacci retracement of the previous bear cycle.
Key Levels
Level Price Role
Entry 104.98 Current price – accumulation zone
Breakout trigger 123.00 Upper channel resistance
Confirmation (TP1) 129.00 First Fibonacci extension target
TP2 143.00 +38% from breakout
TP3 157.00 Psychological + technical
TP4 170.00 Extreme extension
TP5 185.00 261.8% Fibonacci extension
Stop Loss 88.00 Below major swing low & 2024 high
Why $88 is the correct Stop Loss
It sits below the $94.635 monthly wick low (February 2026).
It is also below the previous all-time high resistance turned support from 2024 ($90–92 area).
A break below $88 would invalidate the entire bullish monthly structure.
3. CCI (20, hlc3) – The Critical Signal
Current CCI: 232.94
Recent peak: 324
Overbought threshold: +100
Interpretation
In a strong monthly uptrend, the CCI can remain above +100 for months. The correction from 324 down to 232 is not a bearish divergence – it is a healthy reset of momentum.
What matters now:
The CCI is still deeply in bullish territory (>+200).
It is rebounding from the 200 level, which historically acts as dynamic support in bull markets.
A move back above 280 would signal the next explosive leg up.
Key point: If this were a reversal, the CCI would have dropped below +100. It did not. The structure remains fully bullish.
4. Breakout Confirmation Logic
You are waiting for a breakout above
123
∗
∗
w
i
t
h
c
o
n
f
i
r
m
a
t
i
o
n
o
n
∗
∗
123∗∗withconfirmationon∗∗129.
This is correct because:
$123 represents the upper channel resistance tested multiple times since March.
A daily or weekly close above $129 would also break above the 2022–2023 supply zone, triggering stop-losses and fresh buying.
Once
129
i
s
c
l
e
a
r
e
d
,
t
h
e
n
e
x
t
l
i
q
u
i
d
i
t
y
s
i
t
s
a
t
∗
∗
129iscleared,thenextliquiditysitsat∗∗143** and then $157.
Probable path:
Week of May 18–22: Test $123.
End of May: Close above $129 if geopolitical news remains tense.
June–July 2026: Rally toward
143
–
143–157.
5. Probability Assessment (Based on Your Setup + Current News)
Scenario Probability Conditions Target
Bullish continuation (main scenario) 70% CCI >200, price holds >100, war risk persists 129 → 157 → 185
Shallow correction before breakout 20% Price retests
94
–
94–100, CCI dips to 180 Then same bullish targets
Bull trap & reversal 10% Unexpected peace deal or Iran nuclear agreement Down to $88 or lower
Why only 10% bearish?
Because every news headline as of May 13 points to deterioration, not improvement. The US has mobilized additional naval assets to the Gulf as of yesterday (May 12).
6. Trade Management Recommendations
Entry
Current price $104.98 is acceptable.
If you prefer a better risk/reward, you can scale in:
50% now
25% on a pullback to
100
–
100–101
25% on breakout above $123
Stop Loss
Hard stop at $88 (as you defined)
No trailing stop before $129 to avoid being shaken out by volatility.
Take Profits
Target Action
129 Take partial profit (25%) – move stop to break-even
143 Take another 25%
157 Take another 25%
170–185 Let the last 25% run with a trailing stop
7. Final Conclusion
The monthly trend is bullish. The CCI has reset from extreme levels without breaking structure. The fundamental backdrop (USA–Iran conflict, Hormuz disruption, low OPEC production) supports much higher prices. Your Fibonacci extension targets are realistic and aligned with historical precedents (e.g., 2022 energy crisis).
Confidence level: High (75–80%) for reaching at least $129 in the coming weeks.
Risk reminder: The only clear invalidation is a peace agreement or collapse of the conflict premium. Monitor headlines daily. Until then, hold the long position with your defined SL at $88.
Bullish Continuation & Fibonacci Extension Setup
Executive Summary
Brent is trading at
104.985
∗
∗
o
n
t
h
e
m
o
n
t
h
l
y
t
i
m
e
f
r
a
m
e
,
c
o
n
s
o
l
i
d
a
t
i
n
g
w
i
t
h
i
n
a
s
t
r
o
n
g
b
u
l
l
i
s
h
c
h
a
n
n
e
l
a
f
t
e
r
a
s
h
a
r
p
r
a
l
l
y
t
r
i
g
g
e
r
e
d
b
y
t
h
e
∗
∗
U
S
A
−
I
r
a
n
c
o
n
f
l
i
c
t
e
s
c
a
l
a
t
i
o
n
i
n
e
a
r
l
y
M
a
r
c
h
2026
∗
∗
.
T
h
e
p
r
i
c
e
i
s
c
u
r
r
e
n
t
l
y
c
o
i
l
i
n
g
b
e
l
o
w
a
c
r
i
t
i
c
a
l
b
r
e
a
k
o
u
t
z
o
n
e
n
e
a
r
∗
∗
104.985∗∗onthemonthlytimeframe,consolidatingwithinastrongbullishchannelafterasharprallytriggeredbythe∗∗USA−IranconflictescalationinearlyMarch2026∗∗.Thepriceiscurrentlycoilingbelowacriticalbreakoutzonenear∗∗123. The CCI (20, hlc3) has corrected from an extreme peak of 324 down to 232, which historically indicates a healthy overbought reset within a strong uptrend, not a reversal.
Verdict: The breakout is imminent. The first confirmation will be a daily close above $129, which should trigger acceleration toward the Fibonacci extension targets: 143, 157, 170, and 185 USD.
Stop Loss:
88
∗
∗
E
n
t
r
y
∗
∗
:
88∗∗Entry∗∗:104.985 (current)
1. Geopolitical Context – USA / Iran Conflict (Updated May 2026)
The first confrontation occurred in early March 2026.
Since then, the situation has not de-escalated. On the contrary:
Strait of Hormuz remains partially blocked or under high military alert. Approximately 20% of global oil transit is disrupted.
The Trump administration has rejected new Iranian proposals as of early May. Statements from Washington indicate that "military options remain on the table."
Israel has conducted preemptive strikes against Iranian proxies in Syria (May 10–12, 2026).
OPEC production is at its lowest in 20 years due to sanctions and direct conflict impacts on loading terminals.
Market consensus (Bloomberg, Reuters, May 13):
*"The risk of a full-scale war has risen to 60–70% for Q3 2026. A peace deal before June is now highly unlikely."*
→ This creates a persistent geopolitical risk premium that will not fade quickly. The only catalyst for a sharp drop below $88 would be a surprise peace accord, which contradicts current headlines.
2. Technical Analysis – Monthly Timeframe
Your chart shows a clean bullish channel from the 2020–2023 lows. The price has already broken above the 0.786 Fibonacci retracement of the previous bear cycle.
Key Levels
Level Price Role
Entry 104.98 Current price – accumulation zone
Breakout trigger 123.00 Upper channel resistance
Confirmation (TP1) 129.00 First Fibonacci extension target
TP2 143.00 +38% from breakout
TP3 157.00 Psychological + technical
TP4 170.00 Extreme extension
TP5 185.00 261.8% Fibonacci extension
Stop Loss 88.00 Below major swing low & 2024 high
Why $88 is the correct Stop Loss
It sits below the $94.635 monthly wick low (February 2026).
It is also below the previous all-time high resistance turned support from 2024 ($90–92 area).
A break below $88 would invalidate the entire bullish monthly structure.
3. CCI (20, hlc3) – The Critical Signal
Current CCI: 232.94
Recent peak: 324
Overbought threshold: +100
Interpretation
In a strong monthly uptrend, the CCI can remain above +100 for months. The correction from 324 down to 232 is not a bearish divergence – it is a healthy reset of momentum.
What matters now:
The CCI is still deeply in bullish territory (>+200).
It is rebounding from the 200 level, which historically acts as dynamic support in bull markets.
A move back above 280 would signal the next explosive leg up.
Key point: If this were a reversal, the CCI would have dropped below +100. It did not. The structure remains fully bullish.
4. Breakout Confirmation Logic
You are waiting for a breakout above
123
∗
∗
w
i
t
h
c
o
n
f
i
r
m
a
t
i
o
n
o
n
∗
∗
123∗∗withconfirmationon∗∗129.
This is correct because:
$123 represents the upper channel resistance tested multiple times since March.
A daily or weekly close above $129 would also break above the 2022–2023 supply zone, triggering stop-losses and fresh buying.
Once
129
i
s
c
l
e
a
r
e
d
,
t
h
e
n
e
x
t
l
i
q
u
i
d
i
t
y
s
i
t
s
a
t
∗
∗
129iscleared,thenextliquiditysitsat∗∗143** and then $157.
Probable path:
Week of May 18–22: Test $123.
End of May: Close above $129 if geopolitical news remains tense.
June–July 2026: Rally toward
143
–
143–157.
5. Probability Assessment (Based on Your Setup + Current News)
Scenario Probability Conditions Target
Bullish continuation (main scenario) 70% CCI >200, price holds >100, war risk persists 129 → 157 → 185
Shallow correction before breakout 20% Price retests
94
–
94–100, CCI dips to 180 Then same bullish targets
Bull trap & reversal 10% Unexpected peace deal or Iran nuclear agreement Down to $88 or lower
Why only 10% bearish?
Because every news headline as of May 13 points to deterioration, not improvement. The US has mobilized additional naval assets to the Gulf as of yesterday (May 12).
6. Trade Management Recommendations
Entry
Current price $104.98 is acceptable.
If you prefer a better risk/reward, you can scale in:
50% now
25% on a pullback to
100
–
100–101
25% on breakout above $123
Stop Loss
Hard stop at $88 (as you defined)
No trailing stop before $129 to avoid being shaken out by volatility.
Take Profits
Target Action
129 Take partial profit (25%) – move stop to break-even
143 Take another 25%
157 Take another 25%
170–185 Let the last 25% run with a trailing stop
7. Final Conclusion
The monthly trend is bullish. The CCI has reset from extreme levels without breaking structure. The fundamental backdrop (USA–Iran conflict, Hormuz disruption, low OPEC production) supports much higher prices. Your Fibonacci extension targets are realistic and aligned with historical precedents (e.g., 2022 energy crisis).
Confidence level: High (75–80%) for reaching at least $129 in the coming weeks.
Risk reminder: The only clear invalidation is a peace agreement or collapse of the conflict premium. Monitor headlines daily. Until then, hold the long position with your defined SL at $88.

Verbundene Veröffentlichungen
Haftungsausschluss
Die Informationen und Veröffentlichungen sind nicht als Finanz-, Anlage-, Handels- oder andere Arten von Ratschlägen oder Empfehlungen gedacht, die von TradingView bereitgestellt oder gebilligt werden, und stellen diese nicht dar. Lesen Sie mehr in den Nutzungsbedingungen.
Verbundene Veröffentlichungen
Haftungsausschluss
Die Informationen und Veröffentlichungen sind nicht als Finanz-, Anlage-, Handels- oder andere Arten von Ratschlägen oder Empfehlungen gedacht, die von TradingView bereitgestellt oder gebilligt werden, und stellen diese nicht dar. Lesen Sie mehr in den Nutzungsbedingungen.