
It is amazing how different approaches give same projection
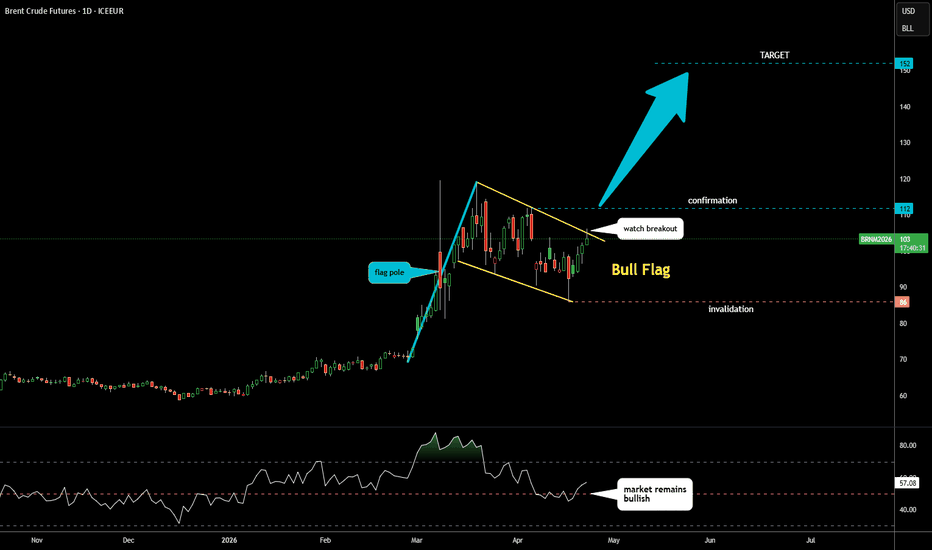
Month ago, I shared with you the Bull Flag pattern on this very same chart
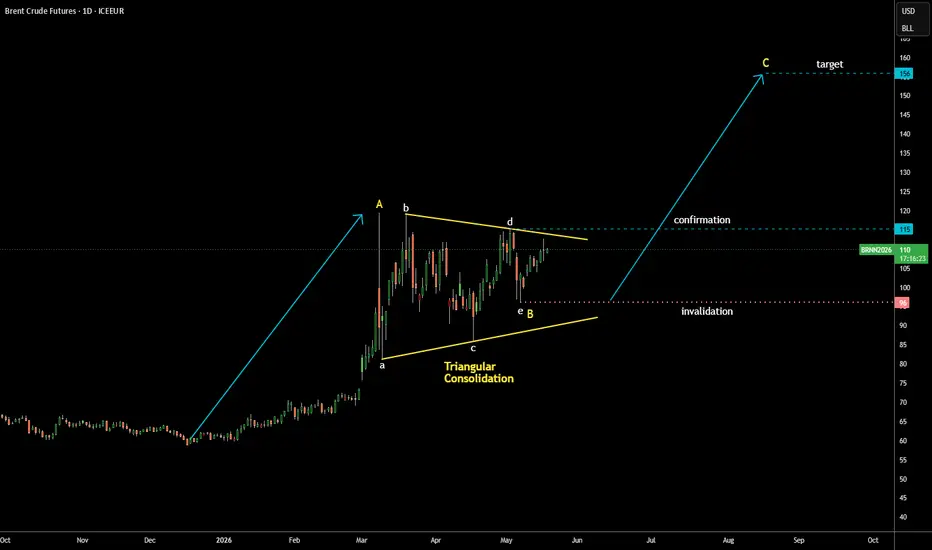
This time, I spotted the EW Triangular consolidation (yellow) in wave B
as part of ABC pattern, which targets the same area above $150 as Bull Flag does
All requirements for triangles have been met, ABCDE sequence looks completed
Wave B (Triangle) retraced exactly to 38.2% Fibonacci level and then bounced up
Bullish confirmation is set above the triangle on the breakout of peak of wave D beyond $115
Wave C could hit $156 mark if its size would be the same as wave A
Invalidation is set at the bottom of wave e of Triangle below $96
Month ago, I shared with you the Bull Flag pattern on this very same chart
This time, I spotted the EW Triangular consolidation (yellow) in wave B
as part of ABC pattern, which targets the same area above $150 as Bull Flag does
All requirements for triangles have been met, ABCDE sequence looks completed
Wave B (Triangle) retraced exactly to 38.2% Fibonacci level and then bounced up
Bullish confirmation is set above the triangle on the breakout of peak of wave D beyond $115
Wave C could hit $156 mark if its size would be the same as wave A
Invalidation is set at the bottom of wave e of Triangle below $96

Verbundene Veröffentlichungen
Haftungsausschluss
Die Informationen und Veröffentlichungen sind nicht als Finanz-, Anlage-, Handels- oder andere Arten von Ratschlägen oder Empfehlungen gedacht, die von TradingView bereitgestellt oder gebilligt werden, und stellen diese nicht dar. Lesen Sie mehr in den Nutzungsbedingungen.
Verbundene Veröffentlichungen
Haftungsausschluss
Die Informationen und Veröffentlichungen sind nicht als Finanz-, Anlage-, Handels- oder andere Arten von Ratschlägen oder Empfehlungen gedacht, die von TradingView bereitgestellt oder gebilligt werden, und stellen diese nicht dar. Lesen Sie mehr in den Nutzungsbedingungen.