
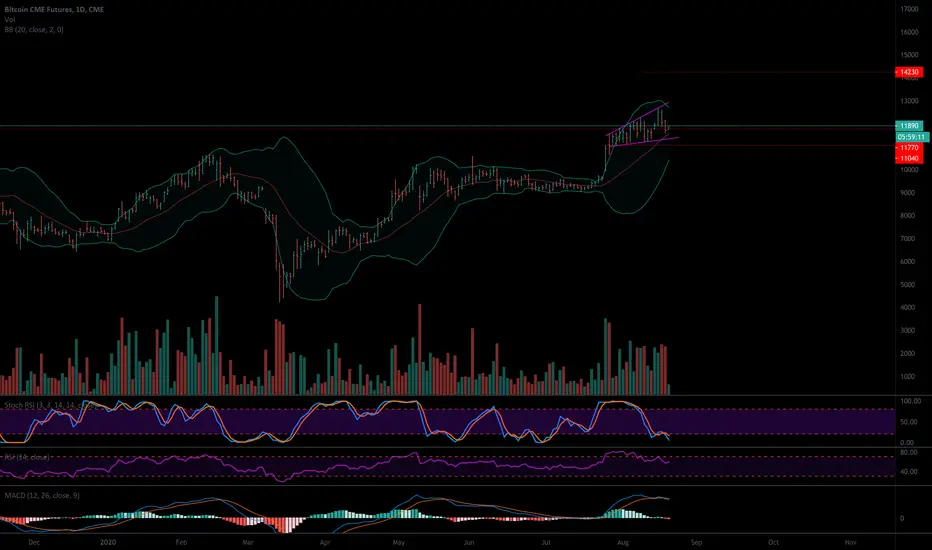
Based on the ascending broadening wedge formed on the CME chart, Bitcoin has a 52% to break down to approx. $11K. However, that means that it has a 48% chance to break to approx. $14K. What do you think? MACD is indicating a break lower. However, here is the good news! These patterns don't typically form in bear markets! They form in BULL markets, so that's interesting evidence pointing to a bull market in Bitcoin! I am LONG, long-term! LET'S GO BULLS! :-)

Haftungsausschluss
Die Informationen und Veröffentlichungen sind nicht als Finanz-, Anlage-, Handels- oder andere Arten von Ratschlägen oder Empfehlungen gedacht, die von TradingView bereitgestellt oder gebilligt werden, und stellen diese nicht dar. Lesen Sie mehr in den Nutzungsbedingungen.
Haftungsausschluss
Die Informationen und Veröffentlichungen sind nicht als Finanz-, Anlage-, Handels- oder andere Arten von Ratschlägen oder Empfehlungen gedacht, die von TradingView bereitgestellt oder gebilligt werden, und stellen diese nicht dar. Lesen Sie mehr in den Nutzungsbedingungen.