
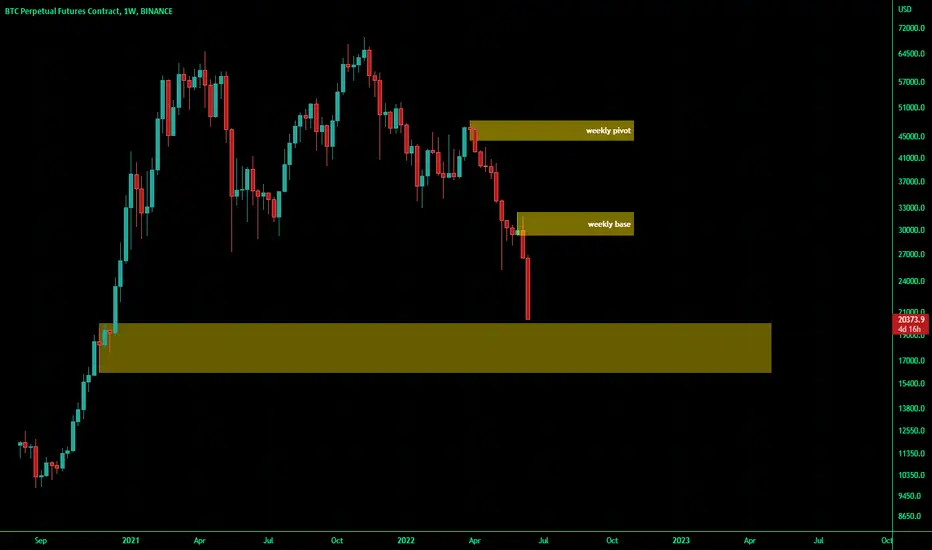
from supply and demand analysis point of view,
the areas that can clearly be seen on the chart are these yellow rectangles the analysis is like having the price stop running down on the lowest area and start an upward to the first green candle and the price will be in a trading range for while (1 year or 2 maybe )
the areas that can clearly be seen on the chart are these yellow rectangles the analysis is like having the price stop running down on the lowest area and start an upward to the first green candle and the price will be in a trading range for while (1 year or 2 maybe )

Haftungsausschluss
Die Informationen und Veröffentlichungen sind nicht als Finanz-, Anlage-, Handels- oder andere Arten von Ratschlägen oder Empfehlungen gedacht, die von TradingView bereitgestellt oder gebilligt werden, und stellen diese nicht dar. Lesen Sie mehr in den Nutzungsbedingungen.
Haftungsausschluss
Die Informationen und Veröffentlichungen sind nicht als Finanz-, Anlage-, Handels- oder andere Arten von Ratschlägen oder Empfehlungen gedacht, die von TradingView bereitgestellt oder gebilligt werden, und stellen diese nicht dar. Lesen Sie mehr in den Nutzungsbedingungen.