
Hello
It's a Bitcoin Guide.
If you "follow"
You can receive real-time movement paths and comment notifications on major sections.
If my analysis was helpful,
Please click the booster button at the bottom.

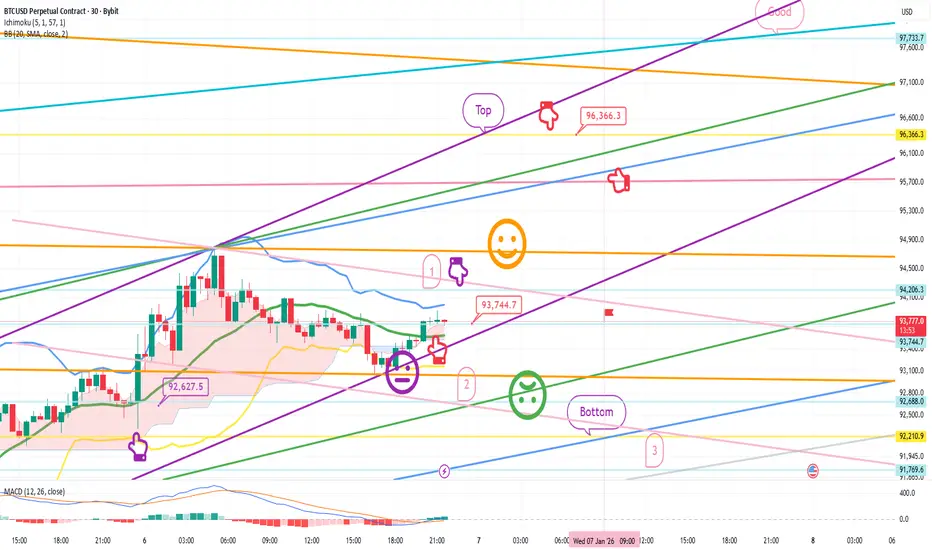
This is the Bitcoin 30-minute chart.
There are no Nasdaq indicators released today.
With the MACD dead cross in progress on the 4-hour chart,
the current position is divided into upside and downside.
Note the pink resistance line and purple support line at the top.
In this situation,
I boldly developed a strategy.
In the lower left corner, the purple finger connects the strategy to the long position entry point, $92,527.5, which was entered yesterday, January 5th.
*If the red finger moves,
I'm following the chase buying strategy.
1. Chase buying at $93,744.7 / Stop loss if the green support line is broken.
2. Long position 1st target price at $96,366.3 -> Good, 2nd target price.
From the current position, if 1 -> If the orange resistance line is broken first,
or the purple parallel line is maintained without breaking away,
there is a possibility of a vertical uptrend.
(Since the second section at the bottom is a sideways market, I intentionally set a generous stop-loss level.)
Conversely, if the price fails to touch the purple finger at the first section above the current level, there's a possibility of a decline to the bottom.
The bottom is the final long position re-entry and waiting area.
Below that, the third section is open, so please be careful.
Please use my analysis to this point for reference only.
I hope you operate safely, adhering to principled trading and stop-loss levels.
Thank you.
It's a Bitcoin Guide.
If you "follow"
You can receive real-time movement paths and comment notifications on major sections.
If my analysis was helpful,
Please click the booster button at the bottom.
This is the Bitcoin 30-minute chart.
There are no Nasdaq indicators released today.
With the MACD dead cross in progress on the 4-hour chart,
the current position is divided into upside and downside.
Note the pink resistance line and purple support line at the top.
In this situation,
I boldly developed a strategy.
In the lower left corner, the purple finger connects the strategy to the long position entry point, $92,527.5, which was entered yesterday, January 5th.
*If the red finger moves,
I'm following the chase buying strategy.
1. Chase buying at $93,744.7 / Stop loss if the green support line is broken.
2. Long position 1st target price at $96,366.3 -> Good, 2nd target price.
From the current position, if 1 -> If the orange resistance line is broken first,
or the purple parallel line is maintained without breaking away,
there is a possibility of a vertical uptrend.
(Since the second section at the bottom is a sideways market, I intentionally set a generous stop-loss level.)
Conversely, if the price fails to touch the purple finger at the first section above the current level, there's a possibility of a decline to the bottom.
The bottom is the final long position re-entry and waiting area.
Below that, the third section is open, so please be careful.
Please use my analysis to this point for reference only.
I hope you operate safely, adhering to principled trading and stop-loss levels.
Thank you.
Trade geschlossen: Stop wurde erreicht
Hello,It's a Bitcoin Guide.
I'll check the movement since writing the analysis on January 6th.
This is a 30-minute chart for the Nasdaq.
Key areas are marked with black fingers.
The light blue fingers indicate a short-to-long switching strategy.
After entering a short position at the top at 25,525.6,
we successfully switched to a long position at the bottom at 25,468.1.
We reached our target price at the top of the range at 25,617.9.
Perfect.
A correction is underway.
To reach a new high, we need to break through the orange resistance line I've highlighted.
This is a 30-minute chart for Bitcoin.
Key areas are marked with black fingers.
Using the red finger chase buying strategy,
after entering a long position at $93,744.7,
it failed to break through the first section of the purple finger at the top,
and instead broke through the green support line at the bottom.
The strategy was to cut my losses.
I applied BTC based on Nasdaq movements,
and yesterday, I aggressively traded with the purple support line as a condition,
but it didn't go down easily.
Nasdaq was perfect, but BTC was a stop loss. Haha.
Yesterday, the best short position was #1 at the top,
and $94,206.3.
Then, #3 below the bottom -> it fell to the indicated $91,462.8.
This section was an important area I explained in my analysis on the 5th.
This week's newly created candlesticks
were breaking the lows on the weekly and daily charts. Yesterday, this section was broken, and the mid-term pattern was also broken,
leading to further declines.
I was hoping to take it easy this month,
but as expected, it's been moving with difficulty.
I'll explain the details in the analysis article.
It was a four-game perfect streak, so it's a shame.
Thank you.

[Bitcoin Guide Affiliate]
*Bybit 20%DC Lifetime + $30,100
partner.bybit.com/b/Bitcoin_Guide
*BingX 50%DC + $14,100
bit.ly/3E8ZkAW
*ZeroMarket ECN 40%DC
bit.ly/3pY0dUv
*Telegram
t.me/bitcoinguide_TM
*Bybit 20%DC Lifetime + $30,100
partner.bybit.com/b/Bitcoin_Guide
*BingX 50%DC + $14,100
bit.ly/3E8ZkAW
*ZeroMarket ECN 40%DC
bit.ly/3pY0dUv
*Telegram
t.me/bitcoinguide_TM
Verbundene Veröffentlichungen
Haftungsausschluss
Die Informationen und Veröffentlichungen sind nicht als Finanz-, Anlage-, Handels- oder andere Arten von Ratschlägen oder Empfehlungen gedacht, die von TradingView bereitgestellt oder gebilligt werden, und stellen diese nicht dar. Lesen Sie mehr in den Nutzungsbedingungen.
[Bitcoin Guide Affiliate]
*Bybit 20%DC Lifetime + $30,100
partner.bybit.com/b/Bitcoin_Guide
*BingX 50%DC + $14,100
bit.ly/3E8ZkAW
*ZeroMarket ECN 40%DC
bit.ly/3pY0dUv
*Telegram
t.me/bitcoinguide_TM
*Bybit 20%DC Lifetime + $30,100
partner.bybit.com/b/Bitcoin_Guide
*BingX 50%DC + $14,100
bit.ly/3E8ZkAW
*ZeroMarket ECN 40%DC
bit.ly/3pY0dUv
*Telegram
t.me/bitcoinguide_TM
Verbundene Veröffentlichungen
Haftungsausschluss
Die Informationen und Veröffentlichungen sind nicht als Finanz-, Anlage-, Handels- oder andere Arten von Ratschlägen oder Empfehlungen gedacht, die von TradingView bereitgestellt oder gebilligt werden, und stellen diese nicht dar. Lesen Sie mehr in den Nutzungsbedingungen.