
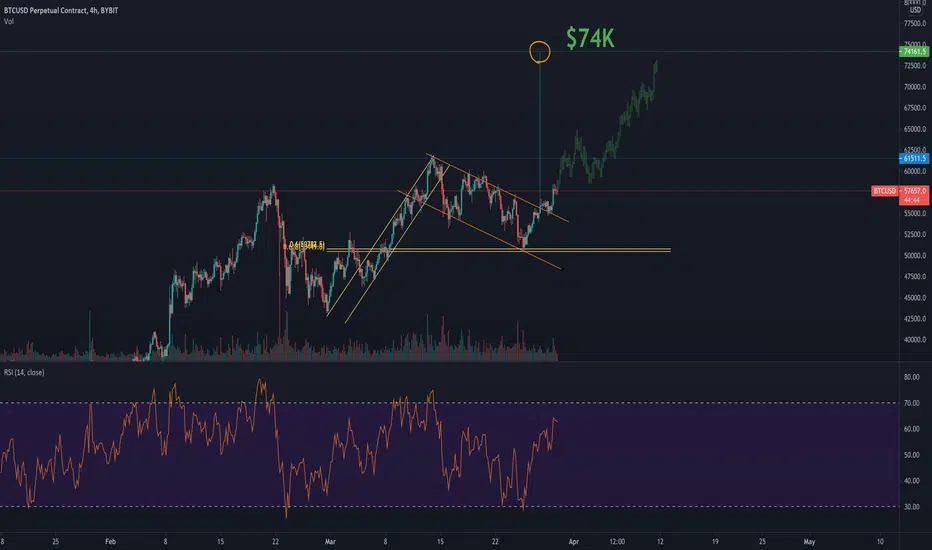
In the chart we can see a Bull Flag Formation that is created by 2 channels, we have some important support and resistance lines. Bitcoin broke the upper resistance line, it may be going to test the line as a support, but not very likely if we gain momentum in the next hours and days.
Target estimated by the projection of distance from the bottom of the pattern to the top gives uy $74K.
Time estimation is probably lead us to think that April will be the month (mid April) to reach the target. That's two weeks from now.
Lastly, we can also see that Fibonacci Golden Pocket played incredibly well at indicating key support level on $50-51K level
Target estimated by the projection of distance from the bottom of the pattern to the top gives uy $74K.
Time estimation is probably lead us to think that April will be the month (mid April) to reach the target. That's two weeks from now.
Lastly, we can also see that Fibonacci Golden Pocket played incredibly well at indicating key support level on $50-51K level

Haftungsausschluss
Die Informationen und Veröffentlichungen sind nicht als Finanz-, Anlage-, Handels- oder andere Arten von Ratschlägen oder Empfehlungen gedacht, die von TradingView bereitgestellt oder gebilligt werden, und stellen diese nicht dar. Lesen Sie mehr in den Nutzungsbedingungen.
Haftungsausschluss
Die Informationen und Veröffentlichungen sind nicht als Finanz-, Anlage-, Handels- oder andere Arten von Ratschlägen oder Empfehlungen gedacht, die von TradingView bereitgestellt oder gebilligt werden, und stellen diese nicht dar. Lesen Sie mehr in den Nutzungsbedingungen.