
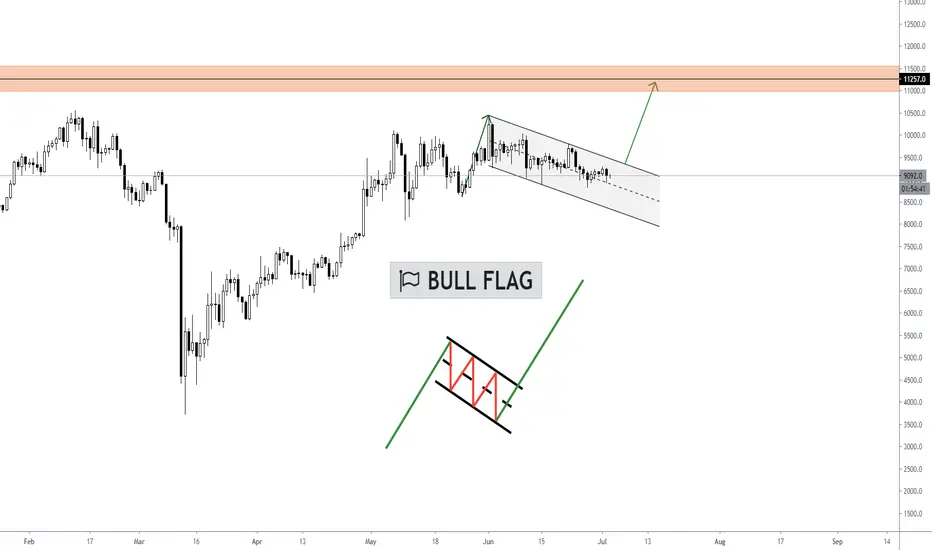
🔸 I'm continuing my experiment. That time I'll try to figure out which tools of classical technical analysis are still working on Bitcoin.
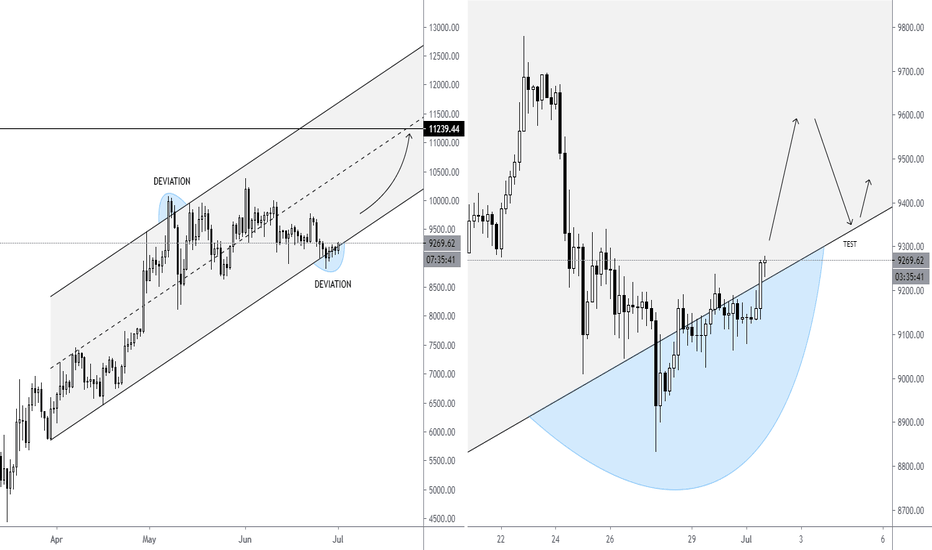
🔸 In my last idea, I considered trendlines from which price periodically deviates to take liquidity:
📈 This time, my attention was drawn to the downward channel on BTC, which perfectly fits "bullish flag" pattern - continuation trend figure.
⚡️ According to the rules, after consolidation in the channel, price must break through the upper border of the flag and cover distance equal to the price movement before forming the pattern.
☝🏻 I don't use this pattern in my trading strategy. Just analyzing statistics of successful ones.
🔸 In my last idea, I considered trendlines from which price periodically deviates to take liquidity:
📈 This time, my attention was drawn to the downward channel on BTC, which perfectly fits "bullish flag" pattern - continuation trend figure.
⚡️ According to the rules, after consolidation in the channel, price must break through the upper border of the flag and cover distance equal to the price movement before forming the pattern.
☝🏻 I don't use this pattern in my trading strategy. Just analyzing statistics of successful ones.
Anmerkung
👀 Bitcoin approached the upper border of the channel.Anmerkung
Anmerkung
🚀 Bitcoin is breaking out of the flag:Trade ist aktiv
After repeatedly testing the upper border of the flag, Bitcoin began an impulsive upward movement:Trade geschlossen: Ziel wurde erreicht

Haftungsausschluss
Die Informationen und Veröffentlichungen sind nicht als Finanz-, Anlage-, Handels- oder andere Arten von Ratschlägen oder Empfehlungen gedacht, die von TradingView bereitgestellt oder gebilligt werden, und stellen diese nicht dar. Lesen Sie mehr in den Nutzungsbedingungen.
Haftungsausschluss
Die Informationen und Veröffentlichungen sind nicht als Finanz-, Anlage-, Handels- oder andere Arten von Ratschlägen oder Empfehlungen gedacht, die von TradingView bereitgestellt oder gebilligt werden, und stellen diese nicht dar. Lesen Sie mehr in den Nutzungsbedingungen.