
🏛️ RESEARCH NOTES
In financial markets, asset prices move in broken waves, seemingly random patterns because they reflect the decentralized and often conflicting decisions of countless participants. No single force dictates this behavior; it emerges from the collective actions of millions acting on different information and expectations. Constantly shifting news and uncertainty cause prices to fluctuate like a stochastic process, similar to Brownian motion. These fluctuations stem from past events, current news, and future speculation often disconnected from fundamentals - and would stabilize only if all outcomes were perfectly known in advance.
Given that markets function as emergent systems in which order develops from iterative interaction cycles, I consider its raw geometry a necessary approach for advancing a more precise understanding of price dynamics as expressed in their behavior.

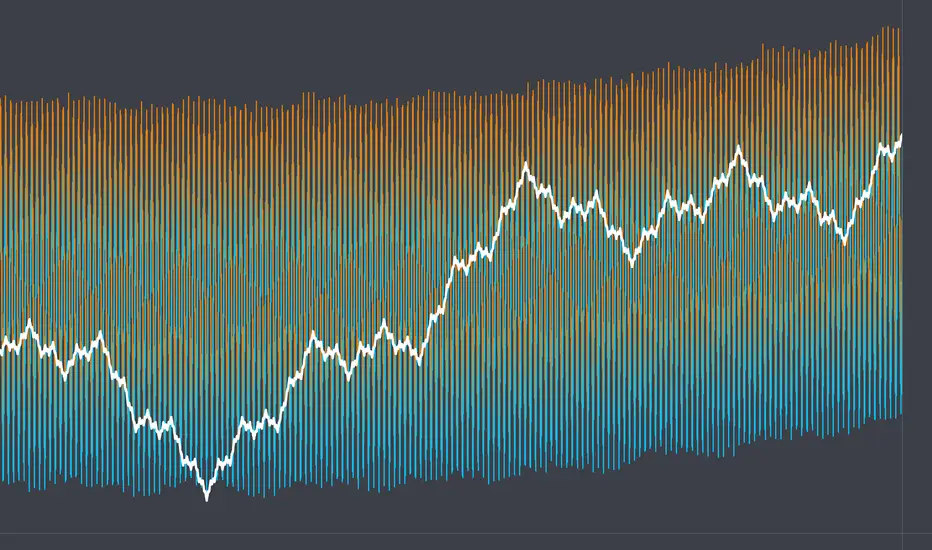
🇩🇪The Weierstrass Function is a classic example of a "fractal curve", as it is continuous and is nowhere differentiable. This means it is infinitely jagged at every single point, so regardless the zoom, it never becomes smooth. Similarly, in markets, the large cycles contain medium cycles, which further scale down to nested micro-cycles.
f(x) = ∑(n=0)^∞ a^n * cos(b^n * π * x)
❖ Shapes of Fractal Cycles
❗️Each added term does not “react” to price. Instead, it generates a composite waveform in which multiple cycles are naturally nested. The resulting fractal wave is topologically organized, meaning it encodes trends of different scales in one structure without any bias toward trend-following.
The Weierstrass function is a generative fractal model that builds waves nested across multiple scales. It doesn’t react to market data but provides a topological view of trend structure, showing how cycles naturally scale and interlock instead of prescribing signals.
In financial markets, asset prices move in broken waves, seemingly random patterns because they reflect the decentralized and often conflicting decisions of countless participants. No single force dictates this behavior; it emerges from the collective actions of millions acting on different information and expectations. Constantly shifting news and uncertainty cause prices to fluctuate like a stochastic process, similar to Brownian motion. These fluctuations stem from past events, current news, and future speculation often disconnected from fundamentals - and would stabilize only if all outcomes were perfectly known in advance.
Given that markets function as emergent systems in which order develops from iterative interaction cycles, I consider its raw geometry a necessary approach for advancing a more precise understanding of price dynamics as expressed in their behavior.
🇩🇪The Weierstrass Function is a classic example of a "fractal curve", as it is continuous and is nowhere differentiable. This means it is infinitely jagged at every single point, so regardless the zoom, it never becomes smooth. Similarly, in markets, the large cycles contain medium cycles, which further scale down to nested micro-cycles.
f(x) = ∑(n=0)^∞ a^n * cos(b^n * π * x)
- a^n → ensures higher-frequency components have smaller amplitude, keeping the series bounded.
- b^n → scales the frequency, creating finer oscillations that nest inside larger cycles.
- N (n_terms) → truncates the infinite sum to a practical number of terms.
- Scale_factor → maps the abstract mathematical domain to the time axis of the price chart.
❖ Shapes of Fractal Cycles
- With default parameters, the function reproduces the characteristic roughness it is known for.
- At a frequency factor of 5, nested cycles are compressed along the time axis, while the frequency and magnitude of reversals increase. The resulting structure closely resembles Elliott wave patterns.
- At a frequency factor of 9, composite cycles emerge at smaller scales. The steep angles cause movements to unfold as rapid but short-lived spikes.
- At extreme values (e.g., frequency factor >1000), cycles overlap extensively, producing dense interference patterns with significant stretching and deformation.
❗️Each added term does not “react” to price. Instead, it generates a composite waveform in which multiple cycles are naturally nested. The resulting fractal wave is topologically organized, meaning it encodes trends of different scales in one structure without any bias toward trend-following.
The Weierstrass function is a generative fractal model that builds waves nested across multiple scales. It doesn’t react to market data but provides a topological view of trend structure, showing how cycles naturally scale and interlock instead of prescribing signals.
Anmerkung
How does it even align with financeIn economics: short-term debt cycles repeat frequently, while long-term debt cycles span decades. Both unfold on top of underlying productivity growth.
In the Weierstrass model: higher-frequency waves (short-term cycles) are layered over lower-frequency waves (long-term cycles).
A model like Weierstrass doesn't emphasize about particular data, it shows how interplay of multiple cycles could be structured naturally. Then you compare real-world data to see where the market is in the multi-scale rhythm.
This is why a price must be viewed as product of ongoing multi-scale oscillations.

Haftungsausschluss
Die Informationen und Veröffentlichungen sind nicht als Finanz-, Anlage-, Handels- oder andere Arten von Ratschlägen oder Empfehlungen gedacht, die von TradingView bereitgestellt oder gebilligt werden, und stellen diese nicht dar. Lesen Sie mehr in den Nutzungsbedingungen.
Haftungsausschluss
Die Informationen und Veröffentlichungen sind nicht als Finanz-, Anlage-, Handels- oder andere Arten von Ratschlägen oder Empfehlungen gedacht, die von TradingView bereitgestellt oder gebilligt werden, und stellen diese nicht dar. Lesen Sie mehr in den Nutzungsbedingungen.