
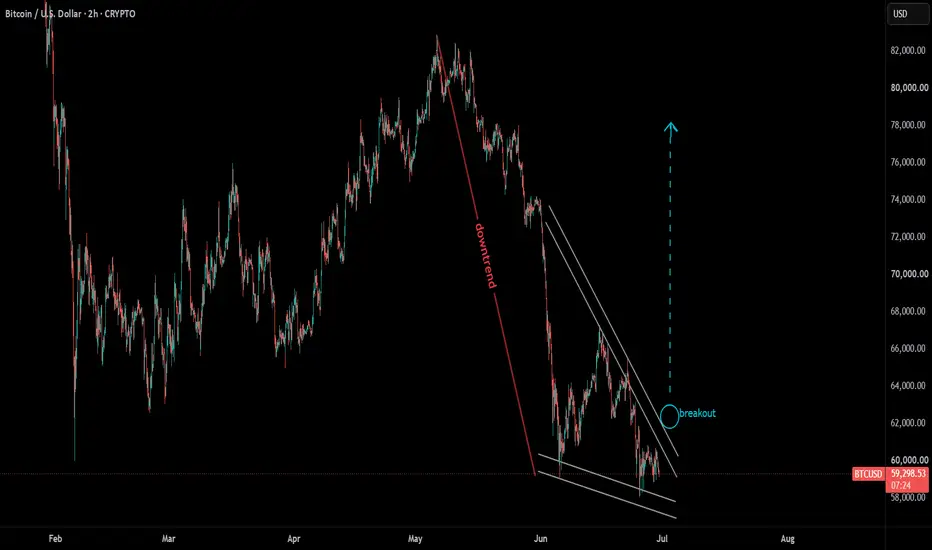
Watch for a clean breakout above the trendline with volume.
Wait for the breakout confirmation before pulling the trigger.
If the falling wedge is accompanied by bullish divergence (price making lower lows, but RSI/MACD making higher lows), it's considered an incredibly strong reversal signal.
Wait for the breakout confirmation before pulling the trigger.
If the falling wedge is accompanied by bullish divergence (price making lower lows, but RSI/MACD making higher lows), it's considered an incredibly strong reversal signal.
Anmerkung
HTF bullish – wedge intact.Anmerkung
Monthly TD9 just printed for the first time since July 2022. That's a major reversal signal – the same one that marked the bottom of the last bear market. It's not a buy signal by itself, but it's a massive warning to bears. RSI divs are also printing across multiple time frames – the stars are aligning for a trend change. If we hold $60k, this could be the start of the next cycle.That's a powerful combo.
Trade ist aktiv
Long at 62K. Falling wedge in play.Anmerkung
The dip to $61,250 was bought up, showing demand near the support zone. Next resistance to watch is the $65,000–$67,000 range.If there's a dip, don't panic — that's your entry, brother. We're still bullish.
Anmerkung
Analysis suggests that the market has entered a recovery phase after establishing a macro bottom near 58,655. While the daily timeframe shows a broad correction from the 82,000 peak, the primary 1-hour timeframe indicates a constructive series of higher lows. A recent spike to 64,415 followed by a retracement to the current price of 63,179 offers a potential entry point for a continuation of the relief rally. Anmerkung
Swing trade setup on the daily — W pattern is forming. If it completes, we ride the breakout.tradingview.com/symbols/BTCUSDT/minds/?mind=pJ-D4owoSQyKda_xBjgI5Q&exchange=BINANCE
Anmerkung
Classic breakout and retest setup. Breakout, retest, then rip.tradingview.com/symbols/BTCUSD/minds/?mind=wI3cyV3fS3CoTFCDYweT_A&exchange=BITSTAMP
Anmerkung
Bitcoin is at its deepest discount relative to gold in history, a condition that has historically preceded massive rallies. Many traders are watching closely to see if this rare signal sparks another long-term surge.Anmerkung
BTC is holding above $62k despite $95M in ETF outflows – that's a sign of strength. CPI is today, and the market is expecting a dovish print. If we get a soft number, BTC could rip to $65k and beyond. But geopolitical risk is high – Iran/Hormuz tensions could spike oil and cause risk-off. Retail is asleep (tweet volume at 12-month lows), which is a classic bottom signal. The HTF structure is bullish – I'm watching for a breakout above $64k to confirm the next leg up. If we reject, I'll look for a pullback to $60k-$61k to buy. Anmerkung
CPI cold print across the board. Macro is now aligned for a breakout. The 70k target (possibly 78k) is coming into play.Anmerkung
Golden pocket retracement is the only tape I need. $57,7k as the bottom is a moot point — the question is the markup phase target. $120k? $150k? $250k? The structure says we're coiling for a major expansion. Your only job now is to accumulate before the next breakout. Stop guessing the bottom — the bottom is in. Start positioning for the top.
Haftungsausschluss
Die Informationen und Veröffentlichungen sind nicht als Finanz-, Anlage-, Handels- oder andere Arten von Ratschlägen oder Empfehlungen gedacht, die von TradingView bereitgestellt oder gebilligt werden, und stellen diese nicht dar. Lesen Sie mehr in den Nutzungsbedingungen.
Haftungsausschluss
Die Informationen und Veröffentlichungen sind nicht als Finanz-, Anlage-, Handels- oder andere Arten von Ratschlägen oder Empfehlungen gedacht, die von TradingView bereitgestellt oder gebilligt werden, und stellen diese nicht dar. Lesen Sie mehr in den Nutzungsbedingungen.