
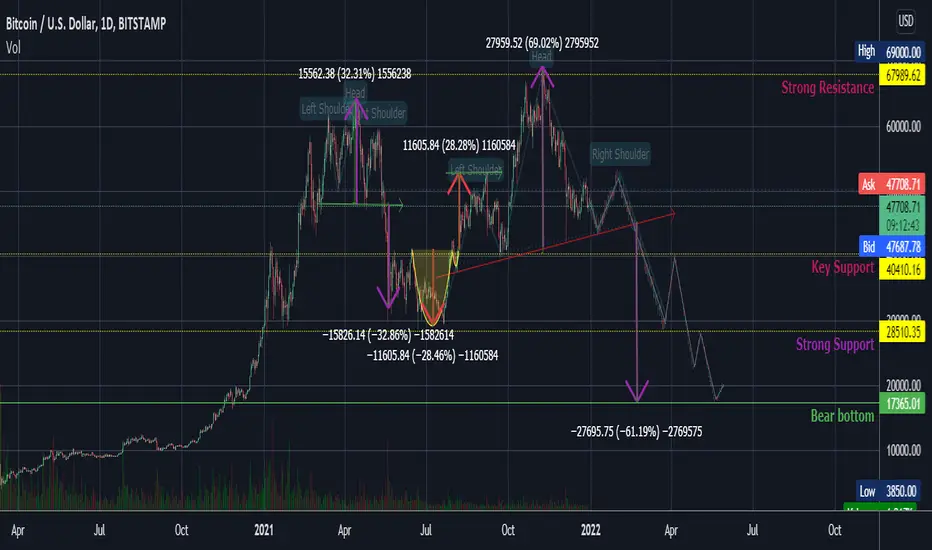
We can see BTC forming massive H&S on daily, weekly and monthly charts. The height of the key support is approximately 70%, and as you know, the fall equals the height percentage. If BTC breaks through the vital support, we have a rough ride down the hill until we hit bear bottom, and after that, we see a price correction which can take six months, 12 months or longer before we see another bull run and new ATH.

Haftungsausschluss
Die Informationen und Veröffentlichungen sind nicht als Finanz-, Anlage-, Handels- oder andere Arten von Ratschlägen oder Empfehlungen gedacht, die von TradingView bereitgestellt oder gebilligt werden, und stellen diese nicht dar. Lesen Sie mehr in den Nutzungsbedingungen.
Haftungsausschluss
Die Informationen und Veröffentlichungen sind nicht als Finanz-, Anlage-, Handels- oder andere Arten von Ratschlägen oder Empfehlungen gedacht, die von TradingView bereitgestellt oder gebilligt werden, und stellen diese nicht dar. Lesen Sie mehr in den Nutzungsbedingungen.