
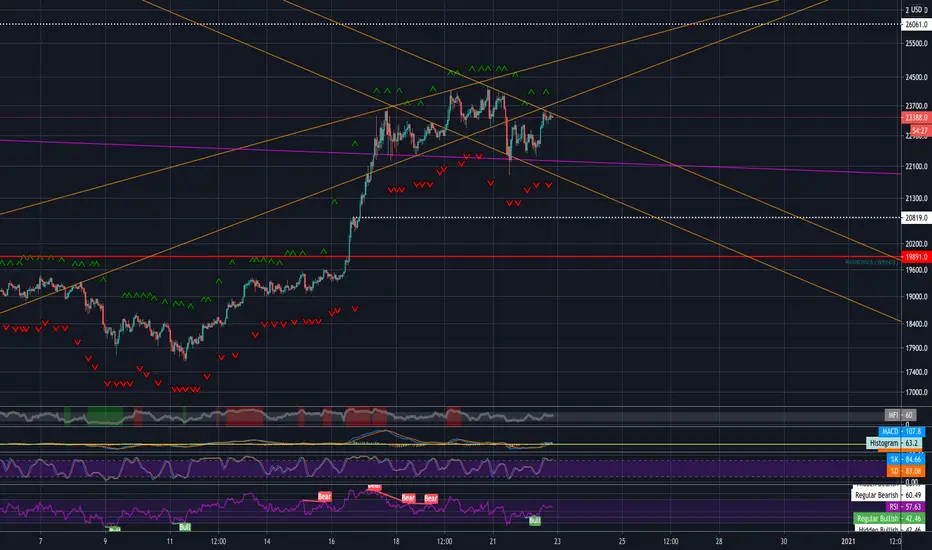
Looking at BTC on 1H chart, I noticed a diamond top pattern, which is not perfect but yet it's there. I drew it with the yellow trendlines . However, the purple trendline in the bottom of the formation is the neckline of a possible H&S pattern, which is also visible on 4H chart, but this is valid if the left shoulder is formed in the near future. Thus, if this yellow trendline which is stopping BTC right now is not broken upside, we might see a drop in the BTC price. Just adding that the current trendline is also the bottom of a wedge from my previous analysis.
Wish you luck!
Wish you luck!
Anmerkung
So, BTC retested the second trendline and now on 30min chart we are forming a small H&S. Let's see how it would develop from here.Anmerkung
Our crypto leader BTC, has completed its 30min H&S and immediately after that we got a pump to test the upper trendline again. However, until the Diamond top is invalidated I am still bearish. Also, looking at the bigger picture now, a bigger Diamond Top is being formed. Order storniert
OMG, breaking the Diamond pattern upside caused a massive buy orders, I am so happy that I was waiting for a break and did not act impulsive to sell. BTC made a 38.2% Fibo retracement and now it stopped at 38.2% of the Fibo extension. 
Haftungsausschluss
Die Informationen und Veröffentlichungen sind nicht als Finanz-, Anlage-, Handels- oder andere Arten von Ratschlägen oder Empfehlungen gedacht, die von TradingView bereitgestellt oder gebilligt werden, und stellen diese nicht dar. Lesen Sie mehr in den Nutzungsbedingungen.
Haftungsausschluss
Die Informationen und Veröffentlichungen sind nicht als Finanz-, Anlage-, Handels- oder andere Arten von Ratschlägen oder Empfehlungen gedacht, die von TradingView bereitgestellt oder gebilligt werden, und stellen diese nicht dar. Lesen Sie mehr in den Nutzungsbedingungen.