
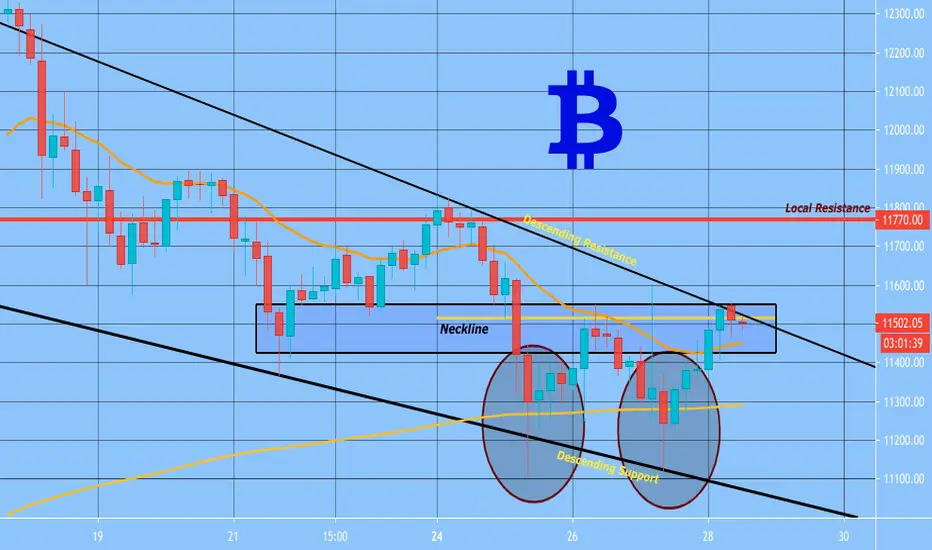
HELLO TRADERS!! I've identified a possible Double Bottom Formation on the 4HR Time. Marked in yellow is the neckline of that formation. Price was tested & rejected from that neckline. I'm expecting bullish action if price manages to break cleanly above that neckline. To add confirmation for a Long, price is currently also sitting above my 20 and 200 Day Moving Averages. The first obvious profit level after breakout would be around $11,770. Reason 1 is because its around Local Resistance. Reason 2 is because it would mean the completion of the Actual Double Bottom Pattern. I still recommend finding a Sniper entry on a smaller Time-frame, but the 4HR gives you clear a direction of possible price movements.
Support My Idea with a Thumbs Up!
Comment Your Thoughts on BTC/USD
Support My Idea with a Thumbs Up!
Comment Your Thoughts on BTC/USD

Haftungsausschluss
Die Informationen und Veröffentlichungen sind nicht als Finanz-, Anlage-, Handels- oder andere Arten von Ratschlägen oder Empfehlungen gedacht, die von TradingView bereitgestellt oder gebilligt werden, und stellen diese nicht dar. Lesen Sie mehr in den Nutzungsbedingungen.
Haftungsausschluss
Die Informationen und Veröffentlichungen sind nicht als Finanz-, Anlage-, Handels- oder andere Arten von Ratschlägen oder Empfehlungen gedacht, die von TradingView bereitgestellt oder gebilligt werden, und stellen diese nicht dar. Lesen Sie mehr in den Nutzungsbedingungen.