
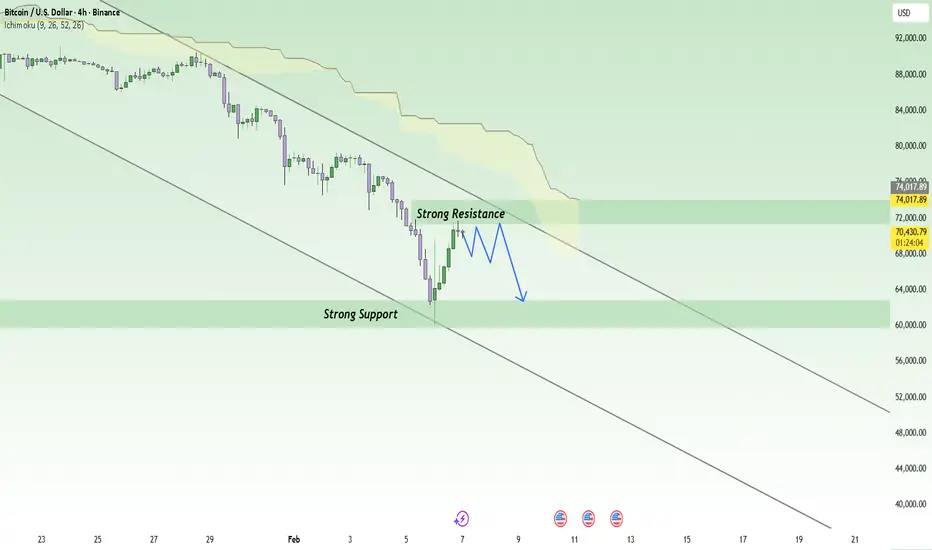
If we set emotions aside and look at the market through a pure trend-following lens, BTCUSD is currently in a state of “a rebound within a broader downtrend” rather than a genuine recovery. The recent price bounces are largely driven by short-covering after panic selling, not by a clear return of strong institutional capital. With market sentiment still cautious, every rally risks turning into an opportunity for distribution.
From a structural perspective, Bitcoin has completely broken its previous bullish base and has entered a clearly defined descending channel on H4. Price remains trapped below the Ichimoku cloud, signaling that the dominant trend has not changed. The bounce from the lows has only produced a lower high, confirming that buyers currently lack the strength to regain control.
The 71,000–71,300 zone stands out as a critical price ceiling. This area is a confluence of the descending trendline and key technical resistance, where selling pressure is highly likely to emerge. If Bitcoin reaches this zone but fails to secure a decisive candle close above it, the probability strongly favors a renewed move to the downside.
In that scenario, the 62,800–63,000 region becomes a logical target for the next bearish leg—aligned with both technical structure and the risk-averse sentiment still dominating the crypto market. At this stage, fighting the trend by trying to catch a bottom carries significant risk, while selling into rallies remains the more disciplined strategy given the current market picture.

LEVEL UP YOUR TRADING
👉t.me/+-HowPr1J4k03NGY1
Signals & setups to boost your edge
Free trading plans to follow
Real-time market insights
👉t.me/+-HowPr1J4k03NGY1
Signals & setups to boost your edge
Free trading plans to follow
Real-time market insights
Verbundene Veröffentlichungen
Haftungsausschluss
Die Informationen und Veröffentlichungen sind nicht als Finanz-, Anlage-, Handels- oder andere Arten von Ratschlägen oder Empfehlungen gedacht, die von TradingView bereitgestellt oder gebilligt werden, und stellen diese nicht dar. Lesen Sie mehr in den Nutzungsbedingungen.