
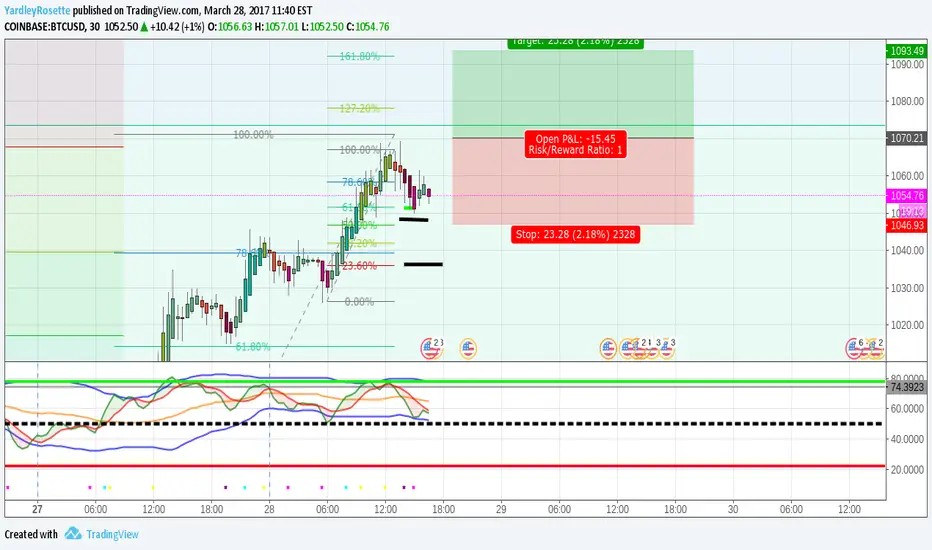
Lower-timeframe, might signal contrary to bigger reversal than the 'continuation' uptrend.
2-Hour chart signals a soon possible downward [SHORT] reversal. Contrary to posted idea [See IMAGE below]
I set a Fibonacci within a major Fibonacci retracement and found this "u-turn". Assuming Market Baseline (Yellow) will continue to show an uptrend.
Even though, this may be the last chance for the price to move down [short] as shown in snapshot image, if it becomes a reversal.
2-Hour chart signals a soon possible downward [SHORT] reversal. Contrary to posted idea [See IMAGE below]
I set a Fibonacci within a major Fibonacci retracement and found this "u-turn". Assuming Market Baseline (Yellow) will continue to show an uptrend.
Even though, this may be the last chance for the price to move down [short] as shown in snapshot image, if it becomes a reversal.
Anmerkung
Price hit 61.8% of past Fibonacci retracement tool placed, if it will continue up, it will rise to at least $1,110.Trade ist aktiv
$1070 Buy Stop entryTrade geschlossen: Ziel wurde erreicht
$1092 trade close
Verbundene Veröffentlichungen
Haftungsausschluss
Die Informationen und Veröffentlichungen sind nicht als Finanz-, Anlage-, Handels- oder andere Arten von Ratschlägen oder Empfehlungen gedacht, die von TradingView bereitgestellt oder gebilligt werden, und stellen diese nicht dar. Lesen Sie mehr in den Nutzungsbedingungen.
Verbundene Veröffentlichungen
Haftungsausschluss
Die Informationen und Veröffentlichungen sind nicht als Finanz-, Anlage-, Handels- oder andere Arten von Ratschlägen oder Empfehlungen gedacht, die von TradingView bereitgestellt oder gebilligt werden, und stellen diese nicht dar. Lesen Sie mehr in den Nutzungsbedingungen.