
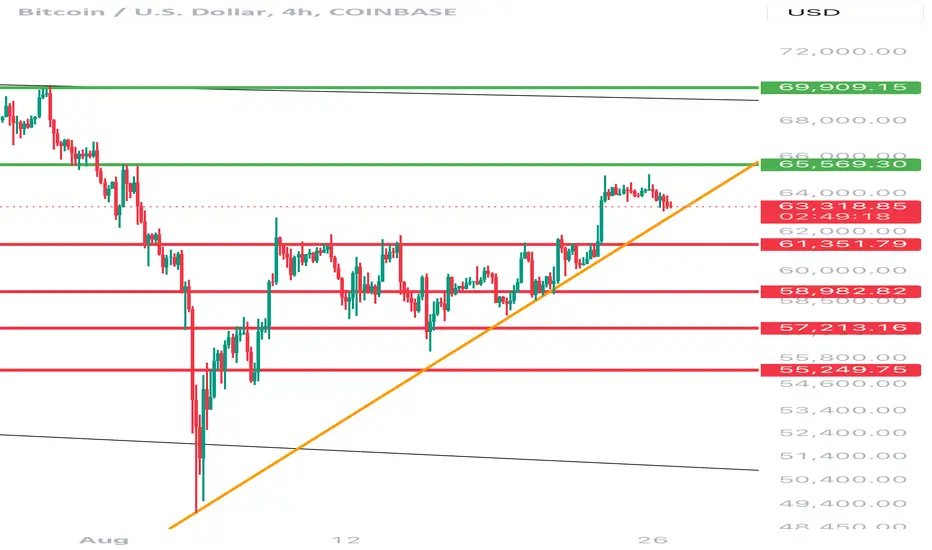
Hello everyone, I invite you to a short review of the BTC to USDT chart with a four-hour time frame. As you can see, we are staying above the locally formed upward trend line.
Taking into account the short time interval, we will first determine possible stop losses:
SL1: $61,351,
SL2: $58,982,
SL3: $57,213,
SL4: $55,249.
Looking the other way, we will define the immediate goals:
T1: 65569USD,
T2: 69909USD.
Taking into account the short time interval, we will first determine possible stop losses:
SL1: $61,351,
SL2: $58,982,
SL3: $57,213,
SL4: $55,249.
Looking the other way, we will define the immediate goals:
T1: 65569USD,
T2: 69909USD.

Haftungsausschluss
Die Informationen und Veröffentlichungen sind nicht als Finanz-, Anlage-, Handels- oder andere Arten von Ratschlägen oder Empfehlungen gedacht, die von TradingView bereitgestellt oder gebilligt werden, und stellen diese nicht dar. Lesen Sie mehr in den Nutzungsbedingungen.
Haftungsausschluss
Die Informationen und Veröffentlichungen sind nicht als Finanz-, Anlage-, Handels- oder andere Arten von Ratschlägen oder Empfehlungen gedacht, die von TradingView bereitgestellt oder gebilligt werden, und stellen diese nicht dar. Lesen Sie mehr in den Nutzungsbedingungen.