
We Are in the Strongest Wave of the Cycle — The BTC Structure Explained
Today we will conduct a long-term study of Bitcoin.
For this analysis, we will use the weekly chart as our main reference.
The first step is interpreting Bitcoin through the lens of Elliott Wave Theory.

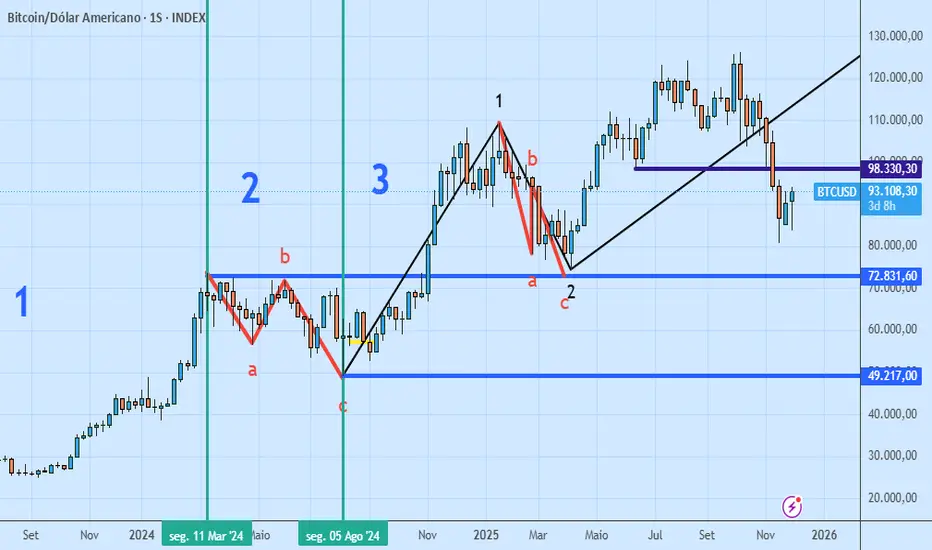
According to our Elliott wave reading, we are currently inside a primary Wave 3, which began in August 2024 around the $49,000 region.
If we break this Wave 3 into its fractal components, we can observe the following:
3.1 — the movement from $49K to $110K
3.2 — the corrective movement from $110K down to approximately $74K
3.3 — the current leg we are in now, technically shaping up to be a new bullish cycle targeting $140,000
Now that we understand we are in Wave 3.3, we need to analyze the overall market trend.
To do that, we will use our Trendline Delta indicator (available for free here on TradingView).
We can clearly see that the market is aligned in a bullish structure, with all three trend-reading bands pointing upward (red, yellow, and green), while the blue region acts as the main support zone.
Based on this structure, I see strong value in positioning a long entry around $85K, using a gradient accumulation strategy with additional entries every $5K — adding new longs at $80K and $75K, targeting $120K and $140K.
The Stop Loss would be placed near $72K, creating a highly attractive risk-to-reward ratio.
If you have any questions, feel free to leave a comment here.
Today we will conduct a long-term study of Bitcoin.
For this analysis, we will use the weekly chart as our main reference.
The first step is interpreting Bitcoin through the lens of Elliott Wave Theory.
According to our Elliott wave reading, we are currently inside a primary Wave 3, which began in August 2024 around the $49,000 region.
If we break this Wave 3 into its fractal components, we can observe the following:
3.1 — the movement from $49K to $110K
3.2 — the corrective movement from $110K down to approximately $74K
3.3 — the current leg we are in now, technically shaping up to be a new bullish cycle targeting $140,000
Now that we understand we are in Wave 3.3, we need to analyze the overall market trend.
To do that, we will use our Trendline Delta indicator (available for free here on TradingView).
We can clearly see that the market is aligned in a bullish structure, with all three trend-reading bands pointing upward (red, yellow, and green), while the blue region acts as the main support zone.
Based on this structure, I see strong value in positioning a long entry around $85K, using a gradient accumulation strategy with additional entries every $5K — adding new longs at $80K and $75K, targeting $120K and $140K.
The Stop Loss would be placed near $72K, creating a highly attractive risk-to-reward ratio.
If you have any questions, feel free to leave a comment here.

FALE COMIGO NO WHATSAPP -acesse.one/trendline
Haftungsausschluss
Die Informationen und Veröffentlichungen sind nicht als Finanz-, Anlage-, Handels- oder andere Arten von Ratschlägen oder Empfehlungen gedacht, die von TradingView bereitgestellt oder gebilligt werden, und stellen diese nicht dar. Lesen Sie mehr in den Nutzungsbedingungen.
FALE COMIGO NO WHATSAPP -acesse.one/trendline
Haftungsausschluss
Die Informationen und Veröffentlichungen sind nicht als Finanz-, Anlage-, Handels- oder andere Arten von Ratschlägen oder Empfehlungen gedacht, die von TradingView bereitgestellt oder gebilligt werden, und stellen diese nicht dar. Lesen Sie mehr in den Nutzungsbedingungen.