
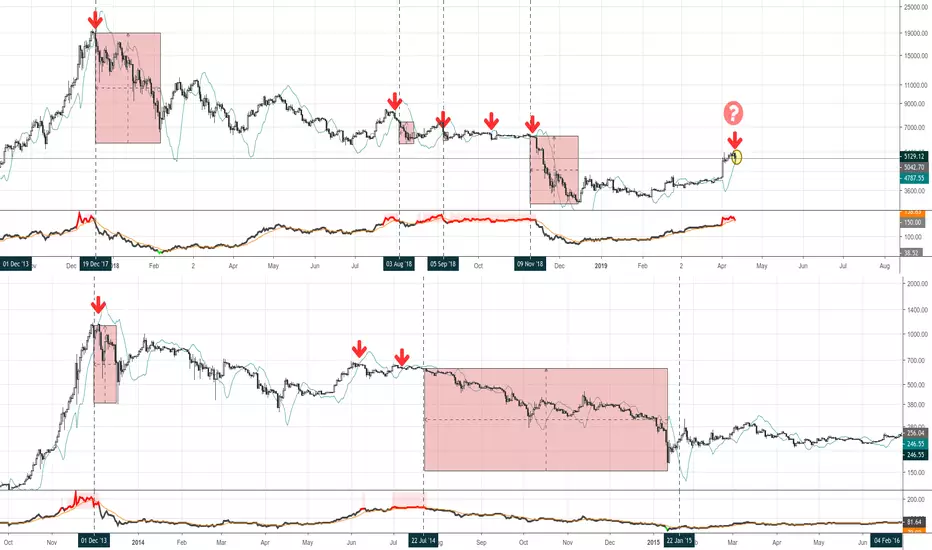
Now that the NVT indicator is back in the red zone, I wanted to look back at the Bitcoin chart to spot potential topping patterns.
I am seeing a likely NVT cross with its signal line by the end of the day (still unconfirmed).
And at the same time, I am plotting here the Dinapoli Momentum Switch indicator in search for key correlations.
And we can see two potential outcomes out of this event happening when the NVT line was red:
a) The start of a significant down correction
b) A choppy consolidation period in front of us where NVT would keep flashing red for some time... just to resolve in a significant down correction
Either way, the results look very consistent... not even a single time a bull trend has started right after these two factors were in confluence. I'd say it became quite the opposite. Is this time different?

I develop indicators meant to be useful, profitable and good looking.
Haftungsausschluss
Die Informationen und Veröffentlichungen sind nicht als Finanz-, Anlage-, Handels- oder andere Arten von Ratschlägen oder Empfehlungen gedacht, die von TradingView bereitgestellt oder gebilligt werden, und stellen diese nicht dar. Lesen Sie mehr in den Nutzungsbedingungen.