
BTC/USD 15-Minute Technical Analysis
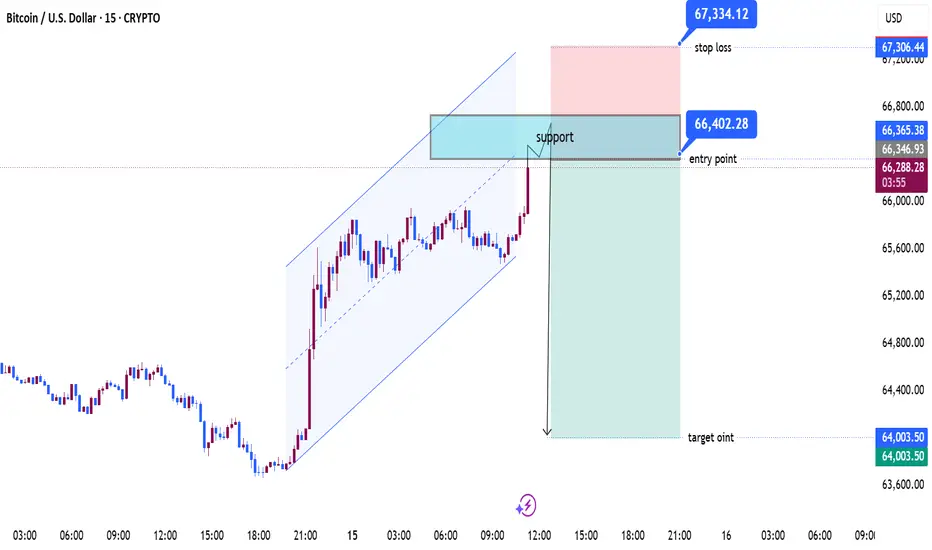
The chart shows Bitcoin (BTC/USD) on the 15-minute timeframe trading inside a rising channel before making a strong bullish breakout toward a key resistance/supply zone.
5
Market Structure
Price has been respecting an ascending channel, indicating a short-term bullish trend.
A strong impulsive candle has broken above the channel's upper boundary, signaling increased buying momentum.
The highlighted blue zone around 66,350–66,650 is acting as a significant resistance/supply area.
Trade Idea (Bearish Rejection Setup)
Entry: 66,402
Stop Loss: 67,334
Target: 64,003
Logic:
Wait for price to retest the resistance zone.
If sellers defend this area and bearish confirmation appears (rejection wick, bearish engulfing, lower high), a short position becomes attractive.
The setup offers a favorable risk-to-reward ratio, targeting a move back toward previous support levels.
Key Levels
Resistance Zone: 66,350 – 66,650
Stop Loss Area: Above 67,300
Target Zone: Around 64,000
Current Price: ~66,175
Bullish Invalidation
A sustained break and close above 66,650–67,300 would invalidate the bearish idea.
In that scenario, BTC could continue toward higher highs, following the momentum from the channel breakout.
Conclusion
The short-term trend remains bullish, but price is approaching a major resistance area. The chart suggests a counter-trend short opportunity if strong rejection occurs near 66,400. Traders should wait for confirmation before entering, as a breakout above resistance could trigger further upside.
The chart shows Bitcoin (BTC/USD) on the 15-minute timeframe trading inside a rising channel before making a strong bullish breakout toward a key resistance/supply zone.
5
Market Structure
Price has been respecting an ascending channel, indicating a short-term bullish trend.
A strong impulsive candle has broken above the channel's upper boundary, signaling increased buying momentum.
The highlighted blue zone around 66,350–66,650 is acting as a significant resistance/supply area.
Trade Idea (Bearish Rejection Setup)
Entry: 66,402
Stop Loss: 67,334
Target: 64,003
Logic:
Wait for price to retest the resistance zone.
If sellers defend this area and bearish confirmation appears (rejection wick, bearish engulfing, lower high), a short position becomes attractive.
The setup offers a favorable risk-to-reward ratio, targeting a move back toward previous support levels.
Key Levels
Resistance Zone: 66,350 – 66,650
Stop Loss Area: Above 67,300
Target Zone: Around 64,000
Current Price: ~66,175
Bullish Invalidation
A sustained break and close above 66,650–67,300 would invalidate the bearish idea.
In that scenario, BTC could continue toward higher highs, following the momentum from the channel breakout.
Conclusion
The short-term trend remains bullish, but price is approaching a major resistance area. The chart suggests a counter-trend short opportunity if strong rejection occurs near 66,400. Traders should wait for confirmation before entering, as a breakout above resistance could trigger further upside.
Trade ist aktiv

join my telegram channel t.me/goldsignalicthttps://t.me/goldsignalicthttps://t.me/goldsignalict
Haftungsausschluss
Die Informationen und Veröffentlichungen sind nicht als Finanz-, Anlage-, Handels- oder andere Arten von Ratschlägen oder Empfehlungen gedacht, die von TradingView bereitgestellt oder gebilligt werden, und stellen diese nicht dar. Lesen Sie mehr in den Nutzungsbedingungen.
join my telegram channel t.me/goldsignalicthttps://t.me/goldsignalicthttps://t.me/goldsignalict
Haftungsausschluss
Die Informationen und Veröffentlichungen sind nicht als Finanz-, Anlage-, Handels- oder andere Arten von Ratschlägen oder Empfehlungen gedacht, die von TradingView bereitgestellt oder gebilligt werden, und stellen diese nicht dar. Lesen Sie mehr in den Nutzungsbedingungen.