
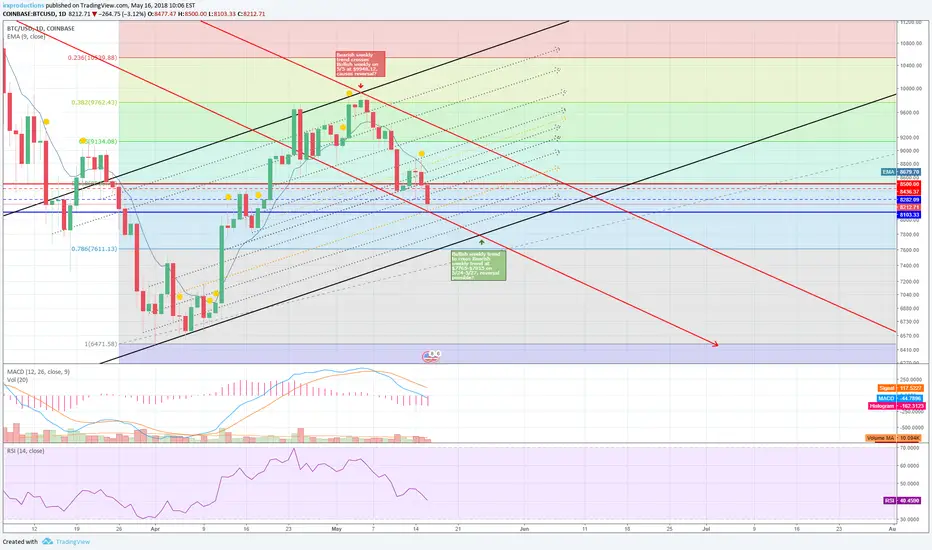
Looking at Bitcoin in the long-term using weekly trend lines, the recent Bearish reversal happened on 5/5 at a high of $9948.12 when a Bearish weekly trend (upper solid red) crossed with a Bullish weekly trend (upper black red).
Taking the theory to the next step, a lower Bearish weekly trend line (lower solid red) may cross with a lower Bullish weekly trend (lower solid black) between 5/24-5/27 at a rough price estimate of $7,765-$7,815.
Could this cause another reversal?
I'm still incredibly green at crypto Technical Analysis, so I'm hoping for to hear suggestions, ideas, and errors I may be making. Thanks, everyone!
Taking the theory to the next step, a lower Bearish weekly trend line (lower solid red) may cross with a lower Bullish weekly trend (lower solid black) between 5/24-5/27 at a rough price estimate of $7,765-$7,815.
Could this cause another reversal?
I'm still incredibly green at crypto Technical Analysis, so I'm hoping for to hear suggestions, ideas, and errors I may be making. Thanks, everyone!

Haftungsausschluss
Die Informationen und Veröffentlichungen sind nicht als Finanz-, Anlage-, Handels- oder andere Arten von Ratschlägen oder Empfehlungen gedacht, die von TradingView bereitgestellt oder gebilligt werden, und stellen diese nicht dar. Lesen Sie mehr in den Nutzungsbedingungen.
Haftungsausschluss
Die Informationen und Veröffentlichungen sind nicht als Finanz-, Anlage-, Handels- oder andere Arten von Ratschlägen oder Empfehlungen gedacht, die von TradingView bereitgestellt oder gebilligt werden, und stellen diese nicht dar. Lesen Sie mehr in den Nutzungsbedingungen.