
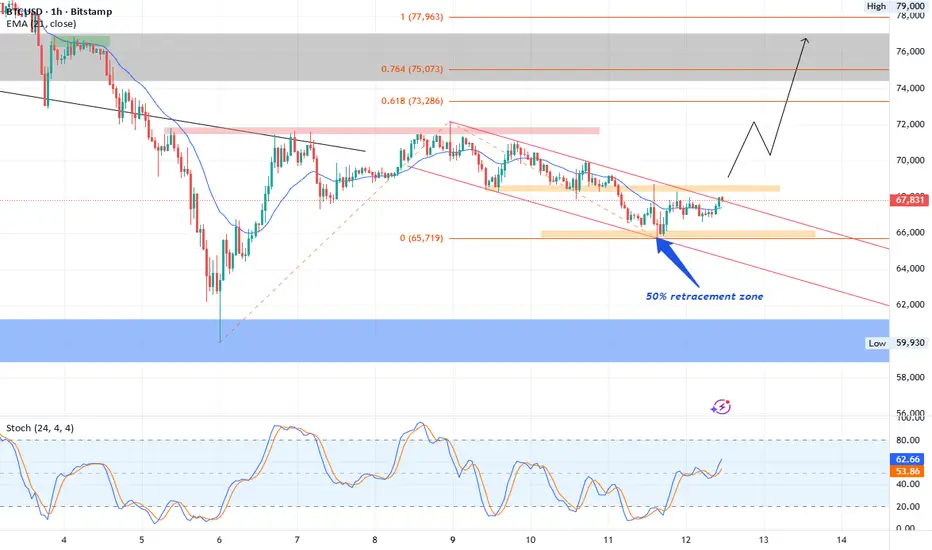
BTC is currently trading inside a well-defined descending channel on the 1H timeframe.
Price has reacted strongly from the 50% Fibonacci retracement zone (65,700–66,000), showing clear bullish rejection from support.
🔎 Market Structure:
1.Descending channel still intact
2.Higher low forming near key support
3.EMA 21 being reclaimed
4.Stochastic crossing upward from oversold zone
📈 Bullish Scenario:
If price breaks above 68,800 – 69,500 resistance zone and confirms a breakout of the channel, we can expect continuation toward:
➡️ 72,000
➡️ 75,000
➡️ 78,000
⚠️ Bearish Scenario:
Failure to break resistance may lead to another rejection toward:
66,000 support
Deeper liquidity near 63,000–62,000
📌 Key confirmation will be a strong close above 70,500.
Price has reacted strongly from the 50% Fibonacci retracement zone (65,700–66,000), showing clear bullish rejection from support.
🔎 Market Structure:
1.Descending channel still intact
2.Higher low forming near key support
3.EMA 21 being reclaimed
4.Stochastic crossing upward from oversold zone
📈 Bullish Scenario:
If price breaks above 68,800 – 69,500 resistance zone and confirms a breakout of the channel, we can expect continuation toward:
➡️ 72,000
➡️ 75,000
➡️ 78,000
⚠️ Bearish Scenario:
Failure to break resistance may lead to another rejection toward:
66,000 support
Deeper liquidity near 63,000–62,000
📌 Key confirmation will be a strong close above 70,500.

Haftungsausschluss
Die Informationen und Veröffentlichungen sind nicht als Finanz-, Anlage-, Handels- oder andere Arten von Ratschlägen oder Empfehlungen gedacht, die von TradingView bereitgestellt oder gebilligt werden, und stellen diese nicht dar. Lesen Sie mehr in den Nutzungsbedingungen.
Haftungsausschluss
Die Informationen und Veröffentlichungen sind nicht als Finanz-, Anlage-, Handels- oder andere Arten von Ratschlägen oder Empfehlungen gedacht, die von TradingView bereitgestellt oder gebilligt werden, und stellen diese nicht dar. Lesen Sie mehr in den Nutzungsbedingungen.