
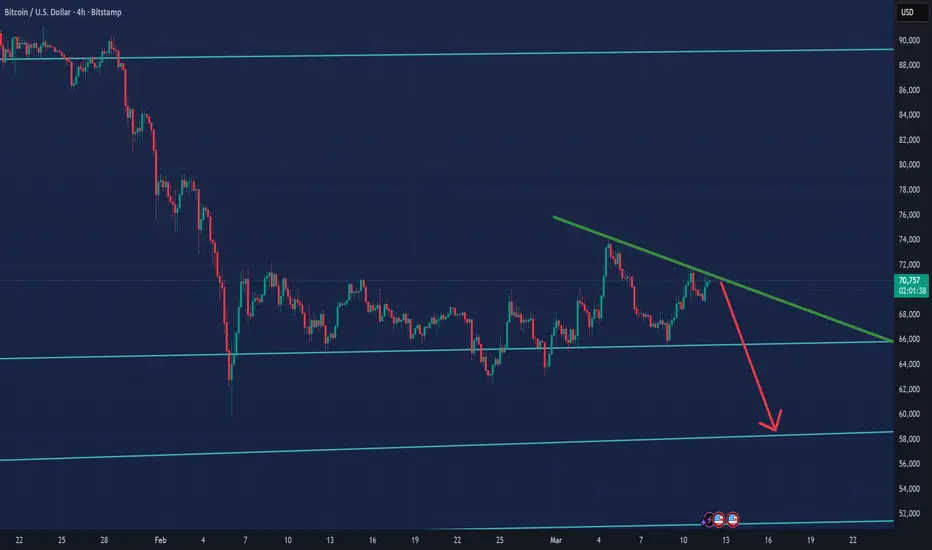
Bitcoin is approaching a descending resistance trendline (green line) after a short-term rally. The price may face resistance near this level.
Key Levels to Watch:
Resistance: Around $70,500–$72,000 (descending trendline)
Support: $66,000 and $59,000 (horizontal support zones)
Traders may observe how BTC reacts to these levels. A clear break above resistance or below support could indicate potential next moves.
This analysis is for informational purposes only and is not financial advice.

Verbundene Veröffentlichungen
Haftungsausschluss
Die Informationen und Veröffentlichungen sind nicht als Finanz-, Anlage-, Handels- oder andere Arten von Ratschlägen oder Empfehlungen gedacht, die von TradingView bereitgestellt oder gebilligt werden, und stellen diese nicht dar. Lesen Sie mehr in den Nutzungsbedingungen.
Verbundene Veröffentlichungen
Haftungsausschluss
Die Informationen und Veröffentlichungen sind nicht als Finanz-, Anlage-, Handels- oder andere Arten von Ratschlägen oder Empfehlungen gedacht, die von TradingView bereitgestellt oder gebilligt werden, und stellen diese nicht dar. Lesen Sie mehr in den Nutzungsbedingungen.