I'm not trading  BTCUSD or cryptos actively but "a chart is a chart" as my my master (he's called MightyOne) says.
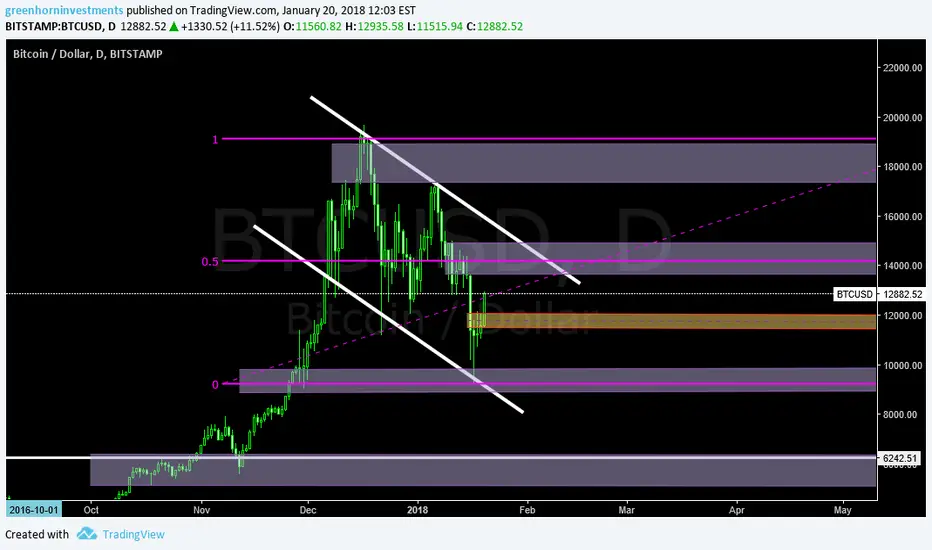
This is how i draw price levels (Supply&Demand) over my charts:
1) Supply is a zone (it doesn't matter how you are drawing it) around the top aka 0% or 25% RET in this chart.
2) Demand is a zone (it doesn't matter how you are drawing it) around the bottom aka 100% or 75% RET in this chart.
3) The midpoint is the midpoint LOL! Use it to take profits or to push in your direction when price is moving away from the actual range.
BTCUSD or cryptos actively but "a chart is a chart" as my my master (he's called MightyOne) says.This is how i draw price levels (Supply&Demand) over my charts:
1) Supply is a zone (it doesn't matter how you are drawing it) around the top aka 0% or 25% RET in this chart.
2) Demand is a zone (it doesn't matter how you are drawing it) around the bottom aka 100% or 75% RET in this chart.
3) The midpoint is the midpoint LOL! Use it to take profits or to push in your direction when price is moving away from the actual range.

Haftungsausschluss
Die Informationen und Veröffentlichungen sind nicht als Finanz-, Anlage-, Handels- oder andere Arten von Ratschlägen oder Empfehlungen gedacht, die von TradingView bereitgestellt oder gebilligt werden, und stellen diese nicht dar. Lesen Sie mehr in den Nutzungsbedingungen.
Haftungsausschluss
Die Informationen und Veröffentlichungen sind nicht als Finanz-, Anlage-, Handels- oder andere Arten von Ratschlägen oder Empfehlungen gedacht, die von TradingView bereitgestellt oder gebilligt werden, und stellen diese nicht dar. Lesen Sie mehr in den Nutzungsbedingungen.