
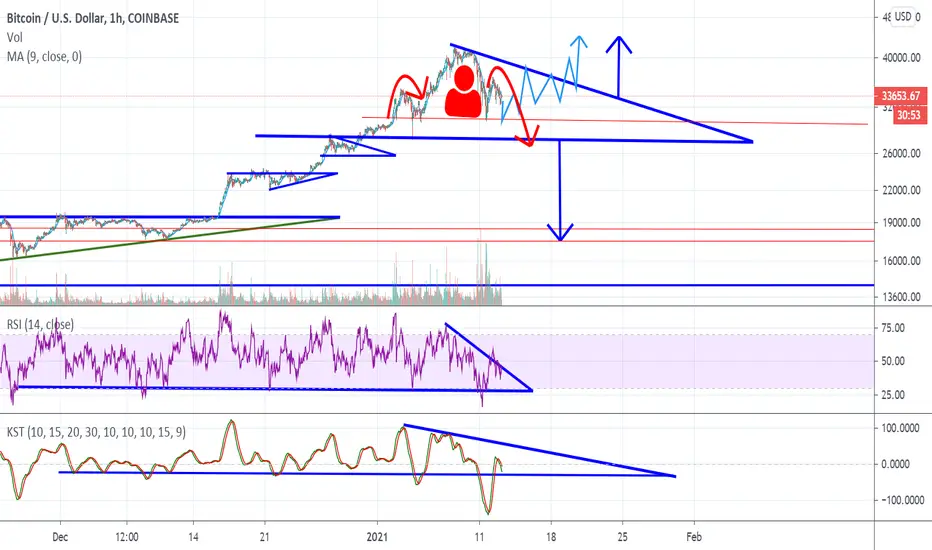
Bitcoin is potentially forming a giant H&S pattern inside of a larger Descending Triangle or Bullish Flag.
In light blue, I have drawn a hypothetical price scenario.
The RSI is breaking the downward sloping resistance of a descending triangle formation.
The KST saw a sharp deviation but has since found itself back into what could turn out as a bull flag or descending triangle.
In Dark Red inside the price pattern is potentially an H&S pattern.
In light blue, I have drawn a hypothetical price scenario.
The RSI is breaking the downward sloping resistance of a descending triangle formation.
The KST saw a sharp deviation but has since found itself back into what could turn out as a bull flag or descending triangle.
In Dark Red inside the price pattern is potentially an H&S pattern.
Anmerkung
Bullish cross now apparent on the KST, updated chart here.. 

Verbundene Veröffentlichungen
Haftungsausschluss
Die Informationen und Veröffentlichungen sind nicht als Finanz-, Anlage-, Handels- oder andere Arten von Ratschlägen oder Empfehlungen gedacht, die von TradingView bereitgestellt oder gebilligt werden, und stellen diese nicht dar. Lesen Sie mehr in den Nutzungsbedingungen.
Verbundene Veröffentlichungen
Haftungsausschluss
Die Informationen und Veröffentlichungen sind nicht als Finanz-, Anlage-, Handels- oder andere Arten von Ratschlägen oder Empfehlungen gedacht, die von TradingView bereitgestellt oder gebilligt werden, und stellen diese nicht dar. Lesen Sie mehr in den Nutzungsbedingungen.