
Hi friends,
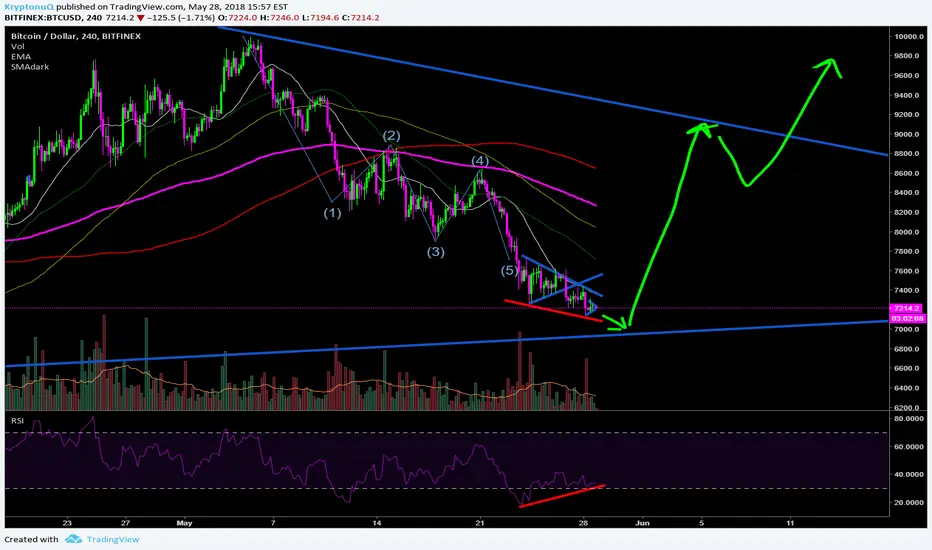
Looking at the 4H chart, we can see a divergence on the RSI that indicates a possible reversal. The turning point should, be the blue trendline at 7k - 6.9k. Looking at buy orders there is a significant buying power between 7k and 6.9k.
I do think everyone is waiting for this buying opportunity.
If we make this reversal, then the target price is the other blue trendline above at 9k. After a small pullback from there, I think we gonna break out from this triangle upwards.
***This is not a financial advice. It is only for educational purpose.***
If you think it was helpful, please leave a like, it means a lot to me. If you have any questions, feel free to leave a comment below.
Anmerkung
Sorry for the missleading elliot waves, the 5th wave is incorrect.
Haftungsausschluss
Die Informationen und Veröffentlichungen sind nicht als Finanz-, Anlage-, Handels- oder andere Arten von Ratschlägen oder Empfehlungen gedacht, die von TradingView bereitgestellt oder gebilligt werden, und stellen diese nicht dar. Lesen Sie mehr in den Nutzungsbedingungen.
Haftungsausschluss
Die Informationen und Veröffentlichungen sind nicht als Finanz-, Anlage-, Handels- oder andere Arten von Ratschlägen oder Empfehlungen gedacht, die von TradingView bereitgestellt oder gebilligt werden, und stellen diese nicht dar. Lesen Sie mehr in den Nutzungsbedingungen.