
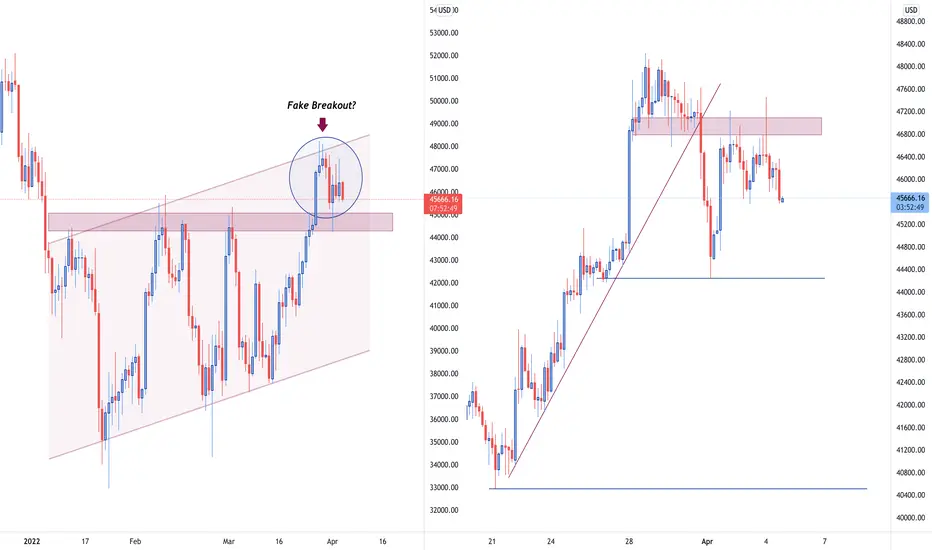
Yes, the price was able to break and close above the 45k zone of strong resistance. But has it been able to continue its upside movements? Does not look like it. If we observe the DAILY timeframe chart, we can identify that an up-trending channel has been formed and the price has nicely rejected the upper boundary of it. The question is the following: did the price spike up above 45k to grab liquidity before dropping? Or it is respecting the formed channel and rejecting the upper boundary of it? Either way, we will act accordingly and elaborate further. Zooming into the H4 timeframe chart, it can be inferred that the price has been able to break below the ascending trend-line that is illustrated on the graph and re-test the local zone of resistance (47k). From here, we can conclude that the price will most likely be continuing its downside movements. However, the accurate target would be unknown, and therefore, we will be looking for short-term targets and taking profits along the way. The upcoming zones of support are the following: 44,200 and 40,500. We will be closely monitoring the price action and observing how far the price can drop before continuing its upside movements.
Hope you enjoy the technical analysis, wizards. Have a great trading week!
Investroy
Hope you enjoy the technical analysis, wizards. Have a great trading week!
Investroy

Haftungsausschluss
Die Informationen und Veröffentlichungen sind nicht als Finanz-, Anlage-, Handels- oder andere Arten von Ratschlägen oder Empfehlungen gedacht, die von TradingView bereitgestellt oder gebilligt werden, und stellen diese nicht dar. Lesen Sie mehr in den Nutzungsbedingungen.
Haftungsausschluss
Die Informationen und Veröffentlichungen sind nicht als Finanz-, Anlage-, Handels- oder andere Arten von Ratschlägen oder Empfehlungen gedacht, die von TradingView bereitgestellt oder gebilligt werden, und stellen diese nicht dar. Lesen Sie mehr in den Nutzungsbedingungen.